New: GPT Image 2.5 Flare and Sunburst. Try them free with 3 images on sign-up, then 8 credits each.
Try GPT Image 2.5

AI Infographic Prompts

Prompts for infographics, diagrams, explainers, and educational posters. They specify the topic, the sections or steps to show, the layout grid, and how text should be handled. Keep labels short and ask for a clear hierarchy, because long paragraphs are the least reliable part of a generated infographic.

Sort by:

Showing 1141–1200 of 1,256 prompts

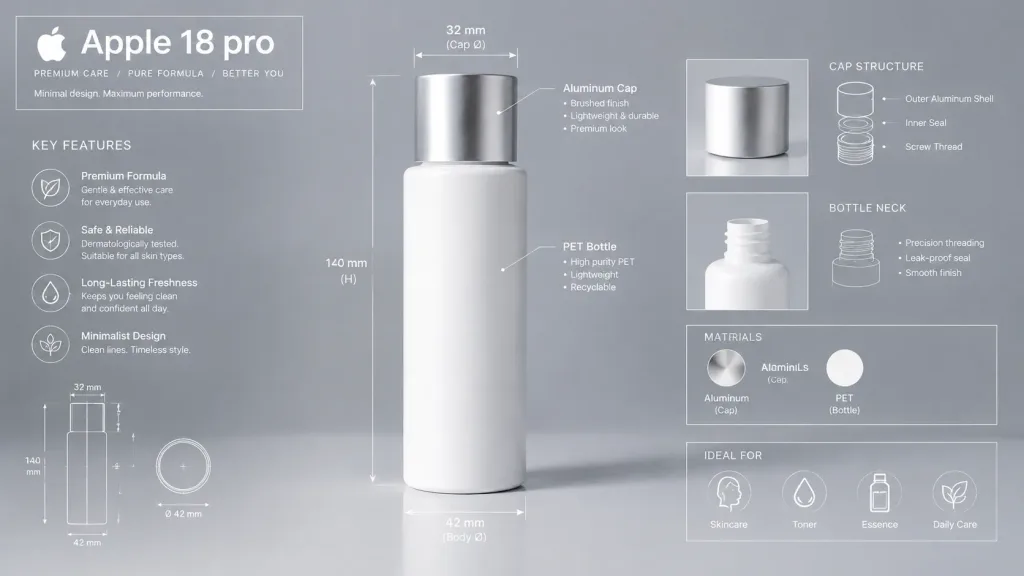
Technical Product Blueprint Infographic

Technical Product Blueprint Infographic

A premium technical infographic of [Apple 18 pro]. Use the reference photo to understand the shape and structure of the object, presenting it in a realistic commercial photograph with clean studio lighting and an aesthetic, modern background. Overlay technical blueprint-style details with fine white lines, directional arrows, dimensional measurements, descriptive labels, and small inset diagrams illustrating parts, materials, and functionality. In the upper-left corner, include a structured title box labeled "[Apple 18 pro]". Crisp, elegant, and informative industrial design presentation.

infographicblueprintproduct design
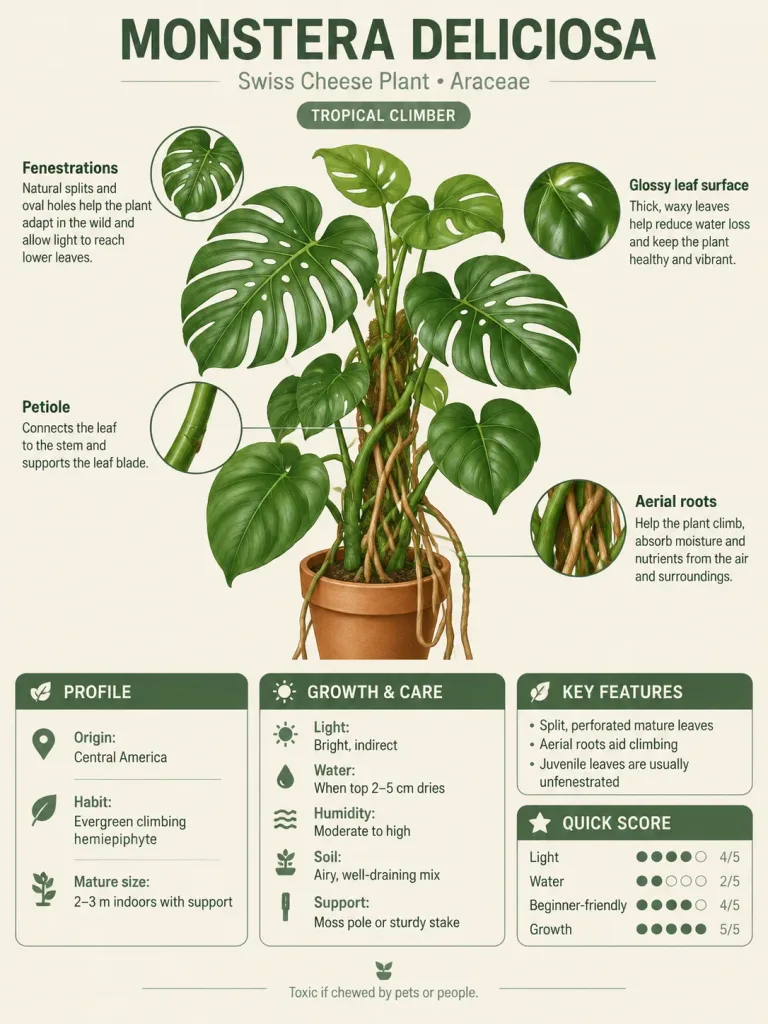
Modular Encyclopedia Knowledge Card

Modular Encyclopedia Knowledge Card

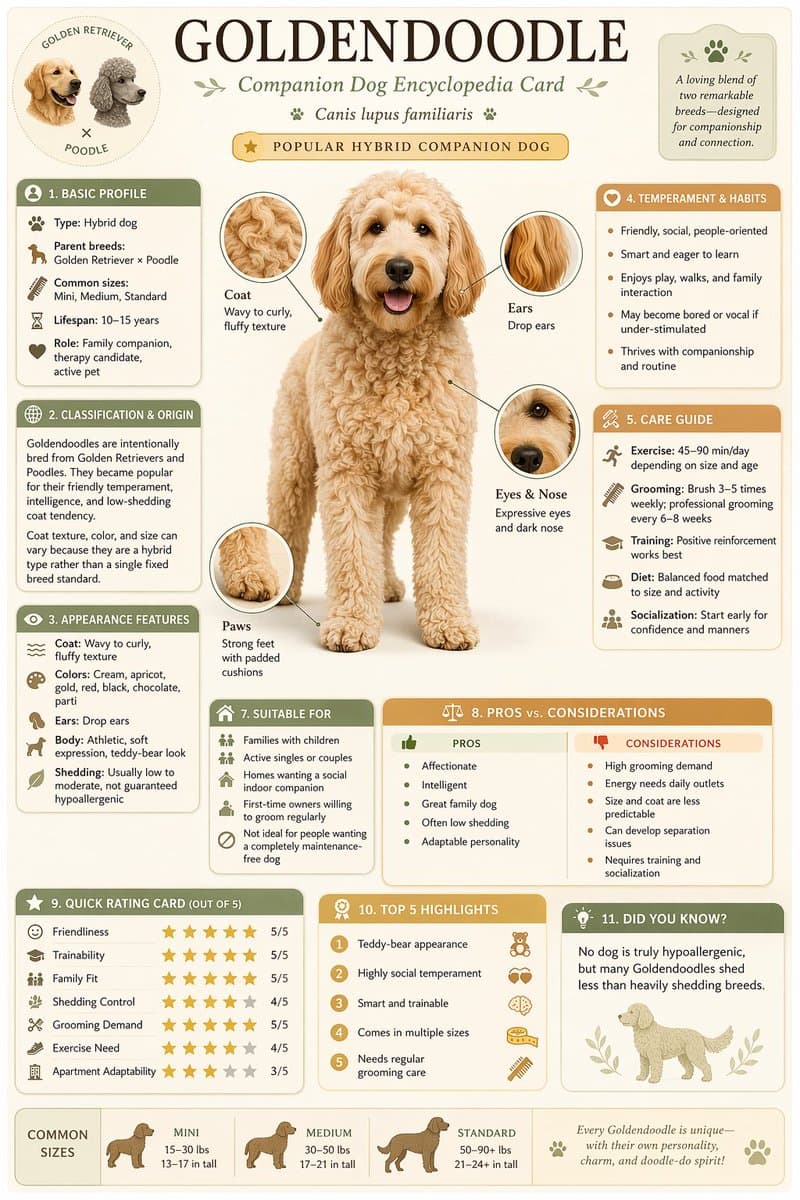
A vertical modular encyclopedia-style educational infographic card about [Monstera Deliciosa]. The layout features a clean, detailed central illustration of the subject with labeled detail callouts and pointer lines. Organized into neat rounded modular information cards including a prominent title header with classification, basic profile, growth and care guide, key characteristics, and a quick rating scorecard or takeaway module. Clean modern field-guide aesthetic, refined minimalist icons, subtle drop shadows, soft balanced colors on an off-white background. High information density with clear typography and an editorial, collectible knowledge-card layout.

infographicencyclopediaknowledge card
Software Architecture Concepts Educational Infographic

Software Architecture Concepts Educational Infographic

An easy-to-understand educational infographic diagram explaining core software architecture concepts in an organized layout: - Section 01: [Frontend] - The user-visible interface, showing web browser and smartphone screens with icons for HTML, CSS, and JavaScript. - Section 02: [Backend] - The logic and calculation layer behind the scenes, featuring server racks and brain icons with tags for Java, Python, Go, and Node.js. - Section 03: [Database] - Data storage and memory, illustrated with relational table cylinders and document folder icons representing MySQL, PostgreSQL, and MongoDB. - Section 04: [SaaS] - Software as a Service, depicting cloud delivery and subscription models across desktop and mobile devices. - Section 05: [Summary Flow] - A horizontal connecting flowchart showing: [Frontend display → Backend processing → Database storage → SaaS delivery]. Style: Modern flat vector infographic, clean layout, pastel color-coded modules, minimalist tech icons, clear readable labels, on a soft off-white background.

infographicsoftware-architectureweb-development
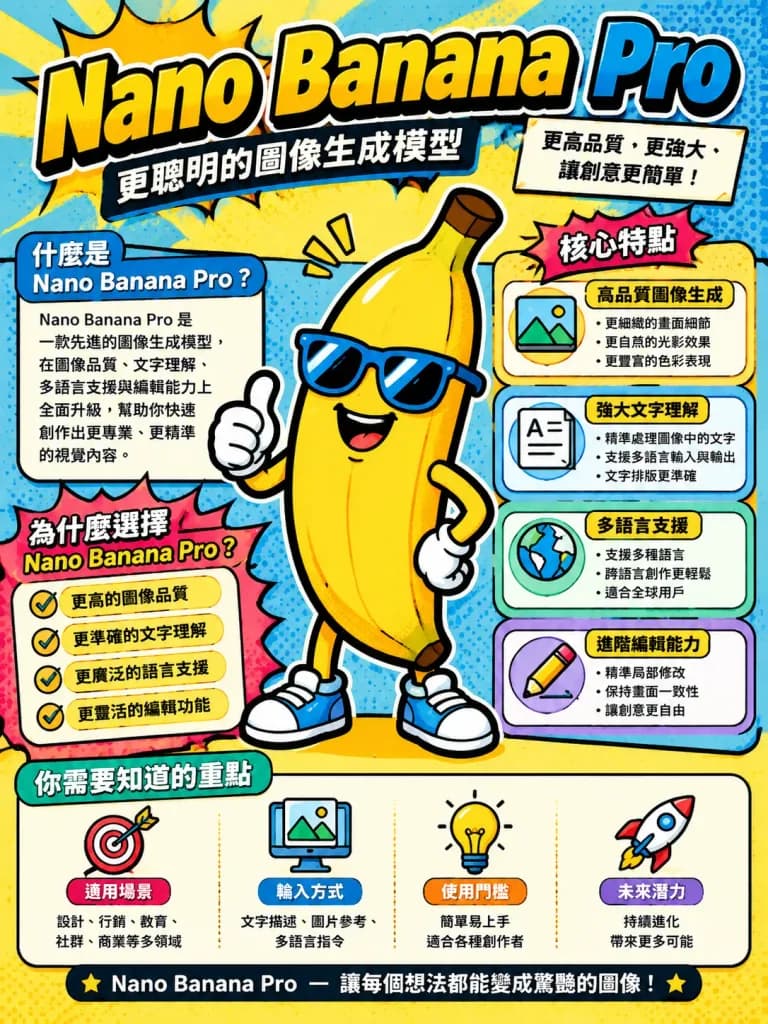
Pop Art Explanatory Tech Infographic

Pop Art Explanatory Tech Infographic

A cartoony, pop-art-inspired educational infographic about [Nano Banana Pro] in a vertical portrait orientation. Features bold graphic outlines, vibrant retro pop-art color palette, halftone dot patterns, clear sectional callout boxes, illustrative icons, and stylized typography breaking down key features and essentials to know.

infographicpop-arteducational
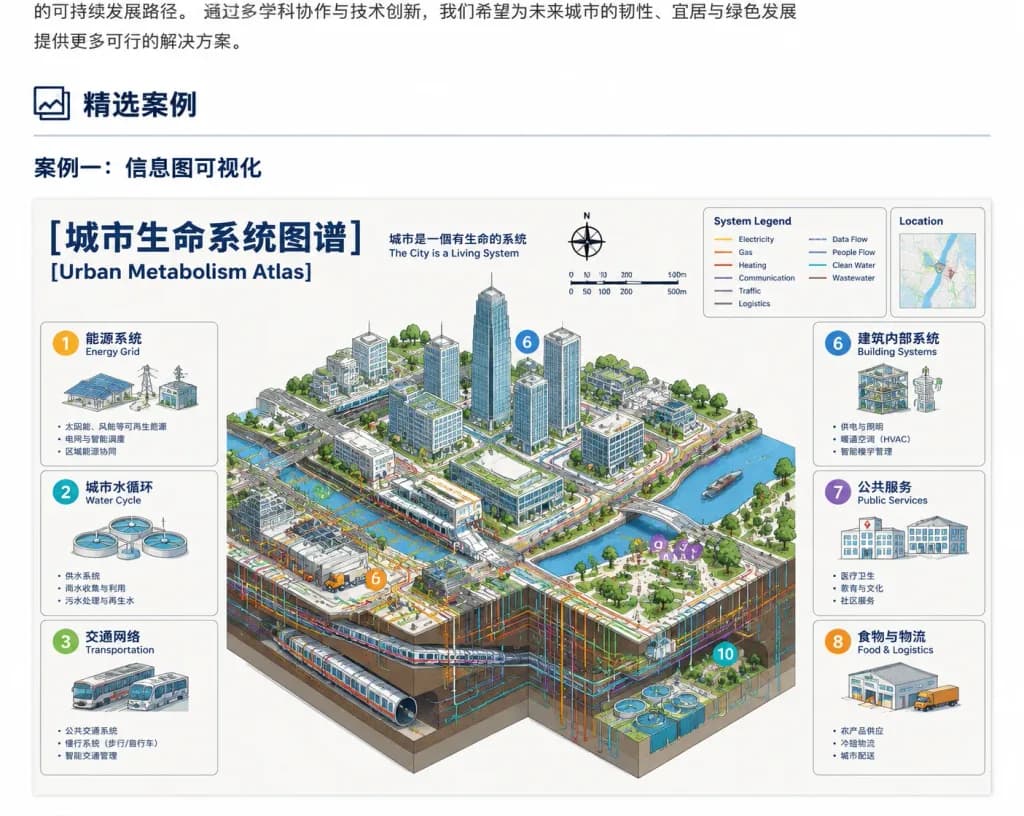
Urban Metabolism Infographic Webpage Case Study

Urban Metabolism Infographic Webpage Case Study

A clean browser-page screenshot showcasing a Chinese case-study section presenting a large bilingual infographic poster about an urban systems map. White webpage background, cropped so the top edge shows the tail end of a Chinese text paragraph and the bottom edge slightly cuts off the poster lower section. At the top-left of the webpage section, a framed icon followed by the bold Chinese heading "精选案例", with a thin gray horizontal divider line underneath spanning most of the width. Below it, a bold subsection title: "案例一:信息图可视化". Centered underneath is a large information-dense bilingual atlas poster titled "[城市生命系统图谱]" with the English subtitle "[Urban Metabolism Atlas]" and small tagline "城市是一個有生命的系統 / The City is a Living System". The poster has an off-white background, navy headline typography, thin gray panel borders, and an isometric cutaway smart city illustration in the center. Top poster elements include a compass rose marked N, a scale bar (0, 50, 100, 200, 500m), a boxed "System Legend" showing 10 colored line types (Electricity, Gas, Heating, Communication, Traffic, Logistics, Data Flow, People Flow, Clean Water, Wastewater), and a small "Location" inset map card. The central isometric illustration shows high-rise towers, roads, bridges, river canals, underground utility and metro cutaways, transit, rooftop solar panels, and colored network flow lines, marked with circular numbered callouts (6, 3, 8, 9, 10). Surrounding the city are 6 rounded rectangular system breakdown cards: Left column cards 1 "能源系统 / Energy Grid", 2 "城市水循环 / Water Cycle", 3 "交通网络 / Transportation"; Right column cards 6 "建筑内部系统 / Building Systems", 7 "公共服务 / Public Services", 8 "食物与物流 / Food & Logistics". Technical architectural infographic aesthetic, clean vector line work, crisp UI rendering, muted grays and whites with cyan, orange, yellow, green accents. No browser URL bar, watermarks, or browser chrome.

infographicsmart cityurban planning
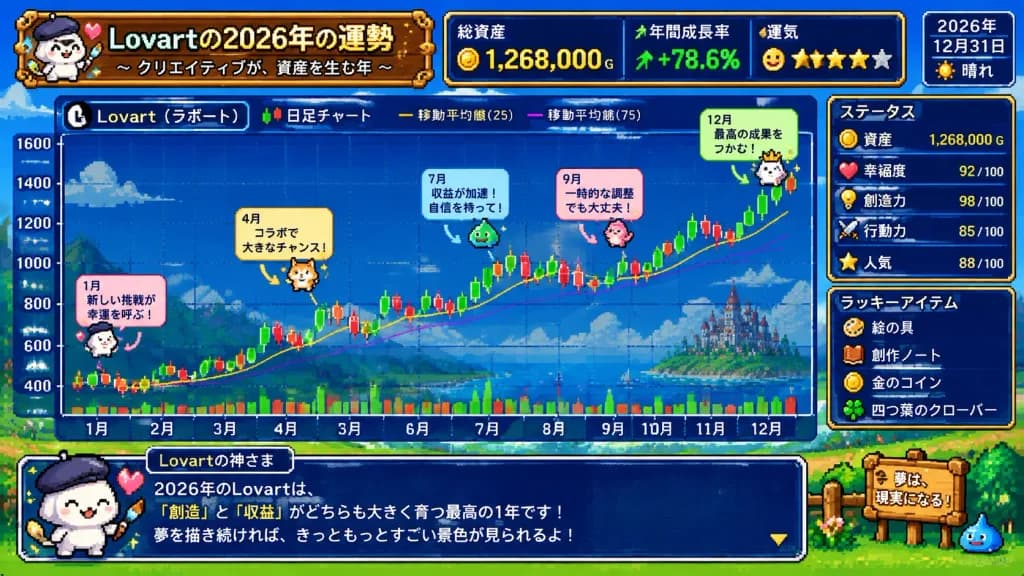
Super Famicom Fortune Candlestick Chart

Super Famicom Fortune Candlestick Chart

Entire screen in 16-bit Super Famicom pixel art style, visualizing the theme 'The Fortune of [Lovart] in 2026'. A colorful financial candlestick chart dominates the screen, with the horizontal X-axis labeled with months from January to December in Japanese ('1月' to '12月'). Thoroughly detailed with Japanese retro game UI text, status metrics, and whimsical annotations. Bright and cute aesthetic, cheerful vibrant color palette, nostalgic RPG simulation HUD elements, and crisp retro pixel graphics.

pixel artsuper famicomcandlestick chart
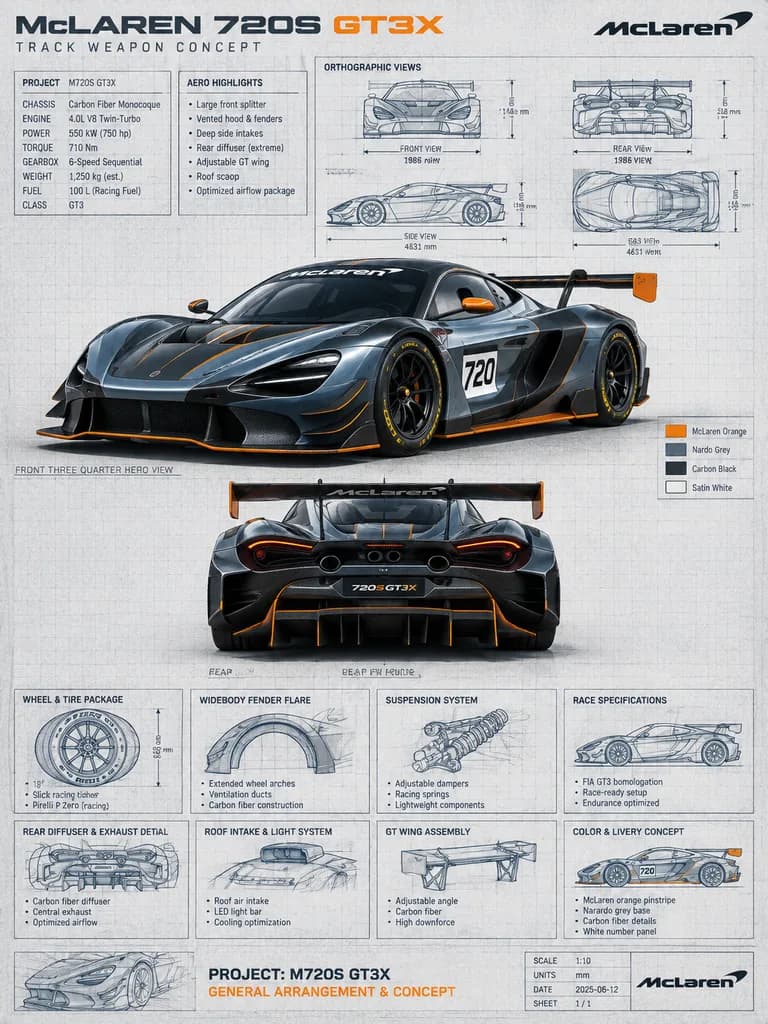
Supercar Technical Blueprint Presentation Poster

Supercar Technical Blueprint Presentation Poster

automotive technical blueprint poster. clean engineering presentation board with grid background, technical callouts, dimension arrows, section boxes, and mixed photoreal render plus hand-drawn blueprint sketches. orthographic views. speci…

blueprintautomotivesupercar
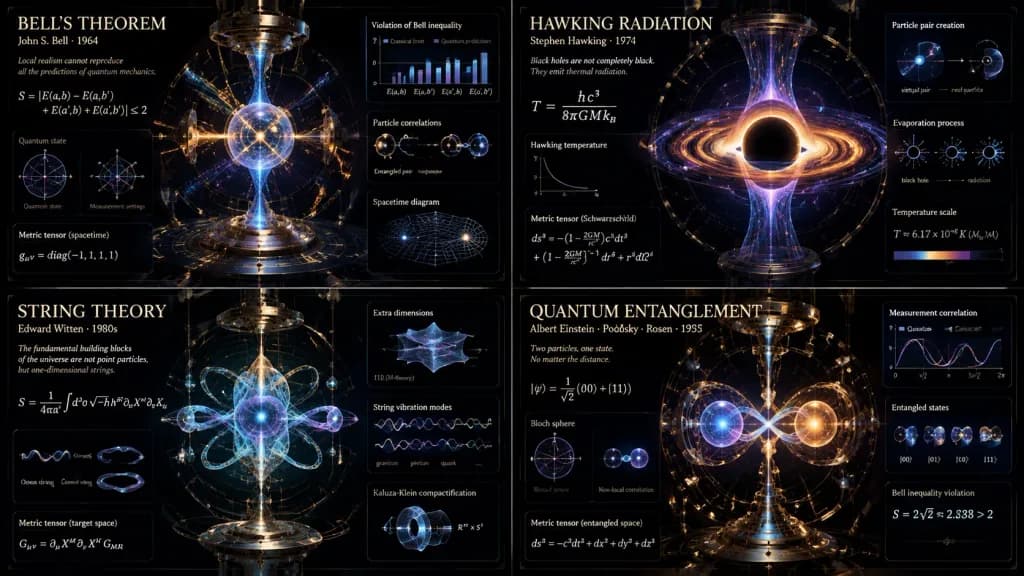
Advanced Theoretical Physics Infographic Grid

Advanced Theoretical Physics Infographic Grid

A 2x2 grid of vertical luxury conceptual scientific infographic posters, visualizing [4 distinct advanced physics theorems or paradoxes, such as Bell's theorem, Hawking radiation, string theory, and quantum entanglement]. Each panel portrays a magnificent scientific machine or optical diorama with exploded schematic layers showing quantum states, gravitational warping, and subatomic scales. Composition: strict radial symmetry and gravitational-well drafting inspired by Large Hadron Collider blueprints, with millimeter-precise drafting and razor-sharp line work contrasting against deep vantablack voids. Materials and details: mathematical formulas solidified into glowing three-dimensional optical glass sculptures bending light; particle collision tracks woven like fine gold thread; Victorian brass optical instruments with precision-milled prisms, lenses, and mirrored refraction planes. Lighting: harsh clinical laser illumination interacting with pure glass against deep space ultraviolet glows. Typography: museum-grade classified schematics with a large title for [the theorem or paradox], a subtitle showing [the physicist and era], and dense microtext displaying [the core equation and metric tensor]. Pristine, hyper-advanced aesthetic with no cartoonish clip art.

infographicphysicsschematic
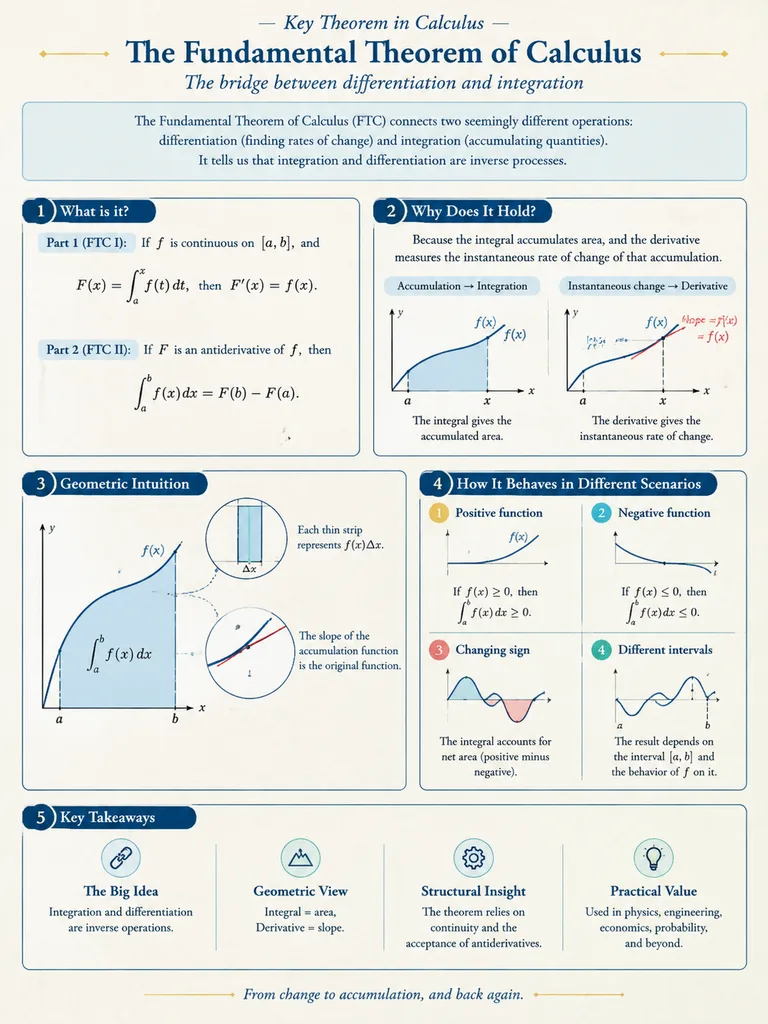
Mathematical Visualization Infographic Poster

Mathematical Visualization Infographic Poster

A mathematical visualization infographic explaining [mathematical concepts/knowledge points], designed to intuitively convey what it is, why it holds true, its geometric and structural intuition, and how it behaves across different scenarios. Styled as a high-quality academic lecture handout combined with a hand-drawn educational poster: elegant, clear, and informative without visual clutter. Layout: [vertical layout] on a clean light-colored paper texture background. Features dark blue headings, black and dark gray line art, accented with touches of cobalt blue, turquoise, gold, and muted red. Includes rounded-corner informational cards, thin borders, numbered labels, hand-drawn indicator arrows, circular magnification insets, and summary columns. Balanced, aesthetic, and rigorous academic illustration.

infographicmathematicsdiagram
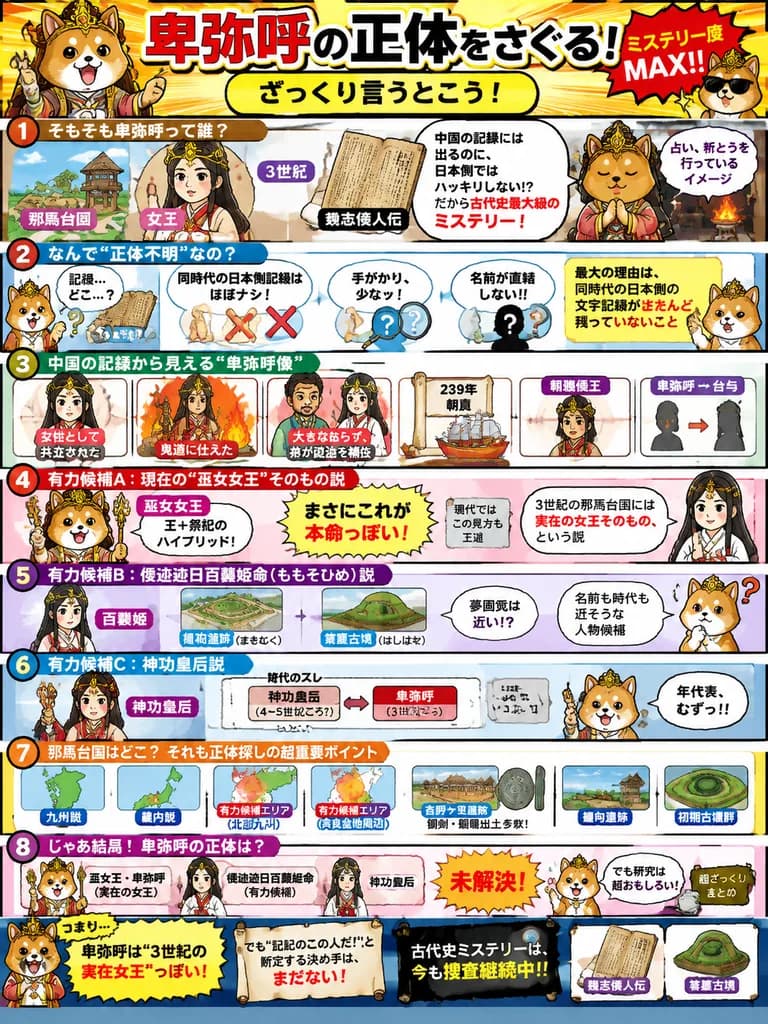
Queen Himiko Manga History Infographic

Queen Himiko Manga History Infographic

Japanese educational history infographic poster. bright manga-style explainer, energetic children's study material, bold comic outlines, vivid colors, dense annotated layout, playful mystery theme, glossy print finish. [cute Shiba Inu masc…

infographicmangaeducational poster
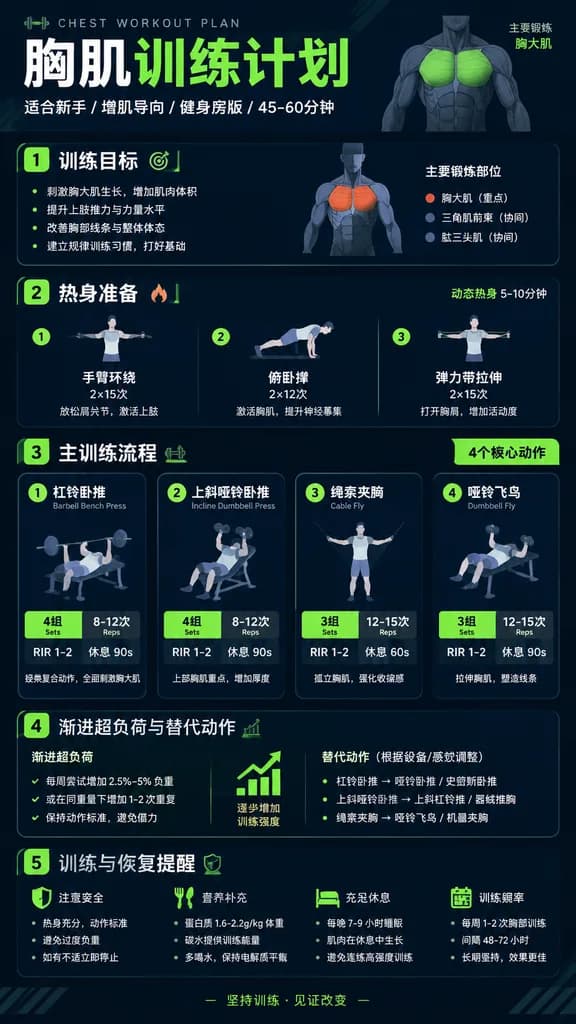
Chinese Fitness Workout Infographic Poster

Chinese Fitness Workout Infographic Poster

A modern, professional vertical fitness infographic poster in Simplified Chinese titled "[胸肌训练计划]" (Chest Workout Plan). Clean modular card layout optimized for mobile viewing, featuring: Header with bold title and subtitle "适合新手 / 增肌导向 / 健身房版 / 45-60分钟"; Section 1: "训练目标" with concise muscle-building bullet points; Section 2: "热身准备" with 3 dynamic warm-up drills; Section 3: "主训练流程" displaying 4 core exercise cards (e.g., 杠铃卧推 Barbell Bench Press, 上斜哑铃卧推 Incline Dumbbell Press, 绳索夹胸 Cable Fly) with prominent badges for Sets × Reps, RIR 1-2, and Rest time; Section 4: "渐进超负荷与替代动作" (Progression and alternatives); Section 5: "训练与恢复提醒" with concise safety and nutrition tips. Style: Sleek athletic graphic design, dark charcoal and deep navy background with crisp white typography and vibrant neon lime green or orange accents, minimalist anatomical muscle highlight diagrams, flat barbell and dumbbell vector icons, immaculate typographic hierarchy, sharp and legible Chinese text.

infographicfitnessworkout-plan
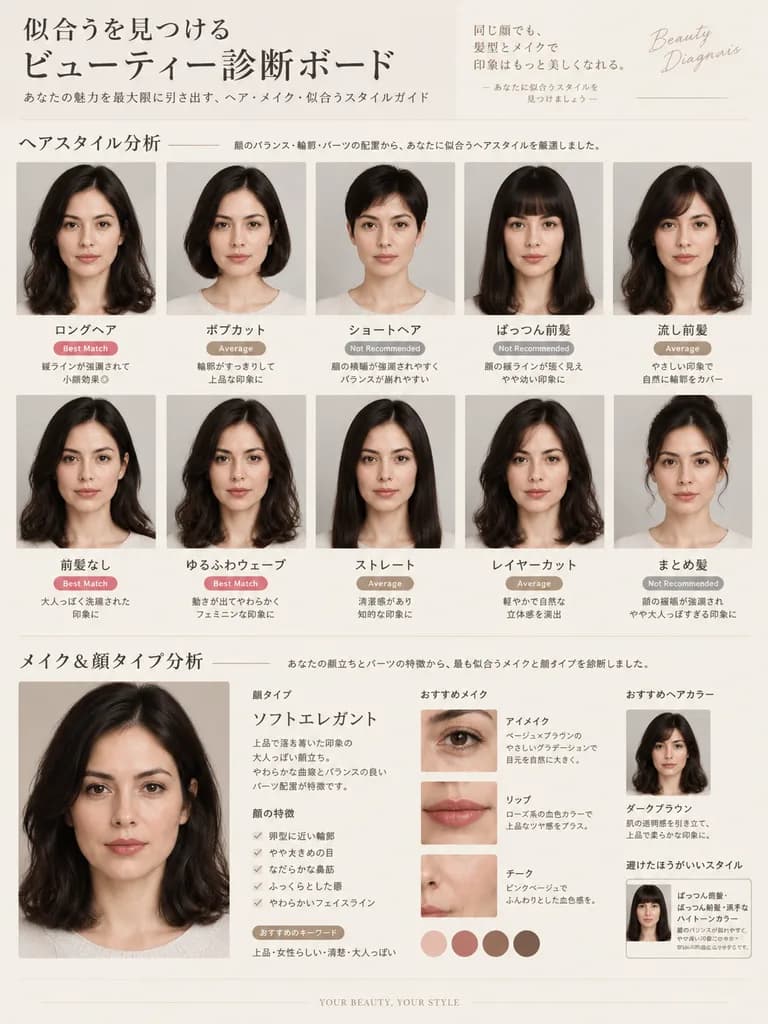
Hairstyle and Makeup Diagnosis Guide

Hairstyle and Makeup Diagnosis Guide

Professional beauty consultation board and diagnostic visual guide based on the reference photo, featuring a [luxurious] editorial aesthetic: Hairstyle Analysis: A grid of side-by-side comparative portraits maintaining the subject's exact facial features, face shape, and likeness from the reference photo. Each portrait demonstrates a distinct hairstyle: long hair, bob cut, short hair, with blunt bangs, side-swept bangs, no bangs, loose waves, sleek straight, layered cut, and an updo. Each style is annotated with chic, minimal evaluation labels such as "Best Match", "Average", and "Not Recommended", demonstrating face-framing and slimming visual effects. Makeup & Face Type Analysis: A magazine-style diagnostic section classifying the face shape and feature category (e.g., Soft Elegant, Feminine, Fresh, Cool Casual, Adult, Child, Curved, or Linear). Subtle, natural makeup variations enhancing her natural features without heavy alteration. Elegant typographic layout in [Japanese], minimal clean text, high-end beauty magazine editorial design, clean neutral studio lighting.

hairstylemakeupbeauty
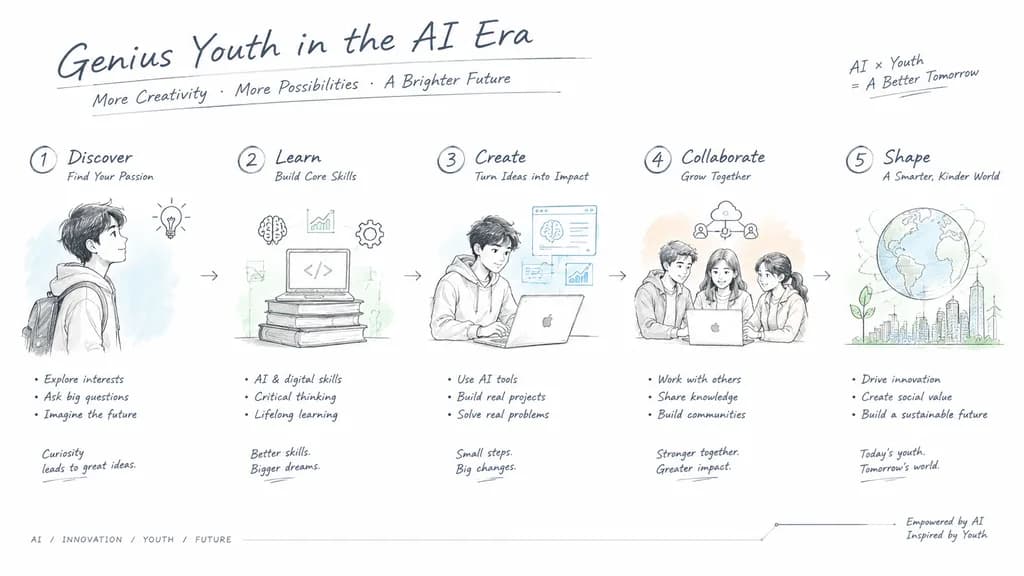
Engineering Hand-Drawn Product Design Slide

Engineering Hand-Drawn Product Design Slide

A complete presentation slide layout designed in a modern engineering hand-drawn sketch style, reminiscent of Apple or Tesla industrial design drafts. Theme: "[Genius Youth in the AI Era]". Pure white background with abundant negative space. Delicate, precise technical drafting lines, dark gray handwritten titles, and engineering annotations outlining sequential steps. Simple line icons paired with clear step descriptions. Subtle, high-transparency watercolor washes in light blue, soft green, and pale orange accents. Clean, professional, and sophisticated technological aesthetic.

presentation slideengineering drawingconcept design
Glossy Magazine Infographic Profile Spread

Glossy Magazine Infographic Profile Spread

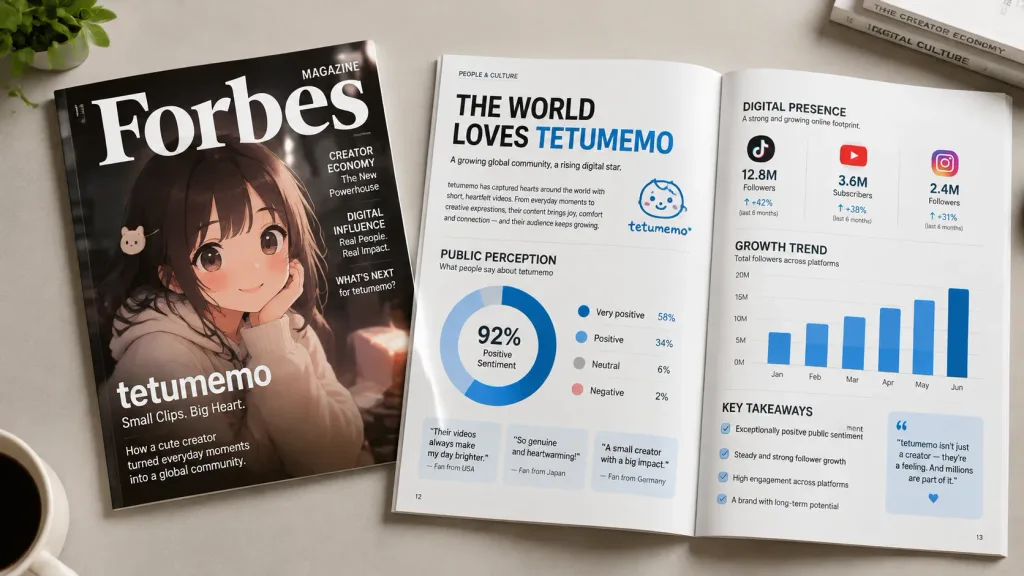
A realistic photo of a glossy editorial magazine spread profiling [tetumemo] ([https://t.co/XcPInQDrVZ]). In the composition, the magazine cover featuring [tetumemo] rests beside an open two-page spread containing a clean, simple infographic with bold headlines, stylized data charts, and commentary summarizing their public perception and digital presence. Studio lighting, crisp paper textures, professional editorial layout design.

infographicmagazine spreadeditorial design
Tri-Cloud Platform Dashboard Infographic

Tri-Cloud Platform Dashboard Infographic

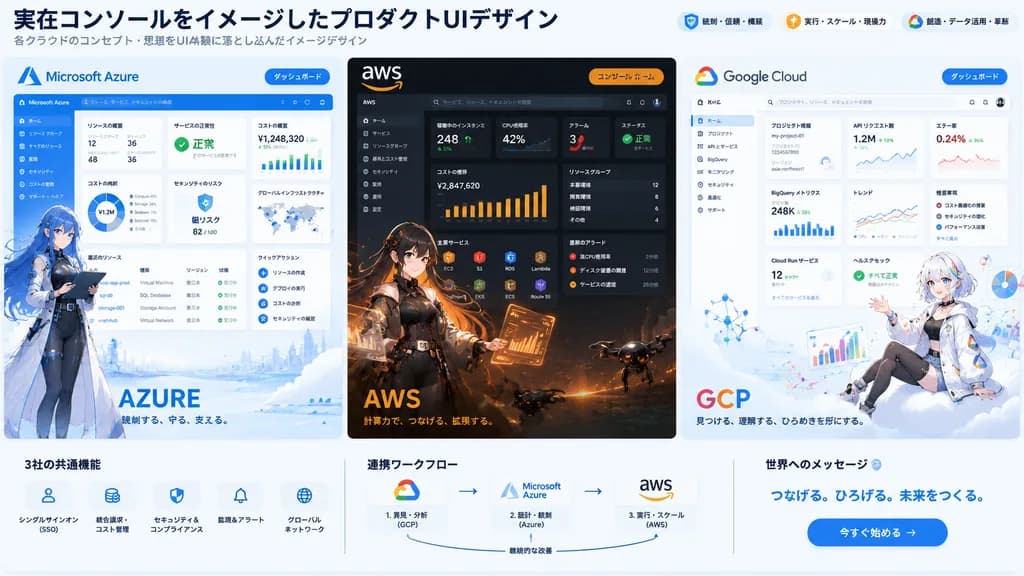
tri-cloud platform hero infographic illustration. high-end product UI concept art combining realistic dashboard interfaces with anime character illustrations, clean corporate tech presentation, crisp vector-like UI mixed with detailed pain…

cloud computingdashboard uianime mascot
Luxury Lifestyle Analysis Infographic Poster

Luxury Lifestyle Analysis Infographic Poster

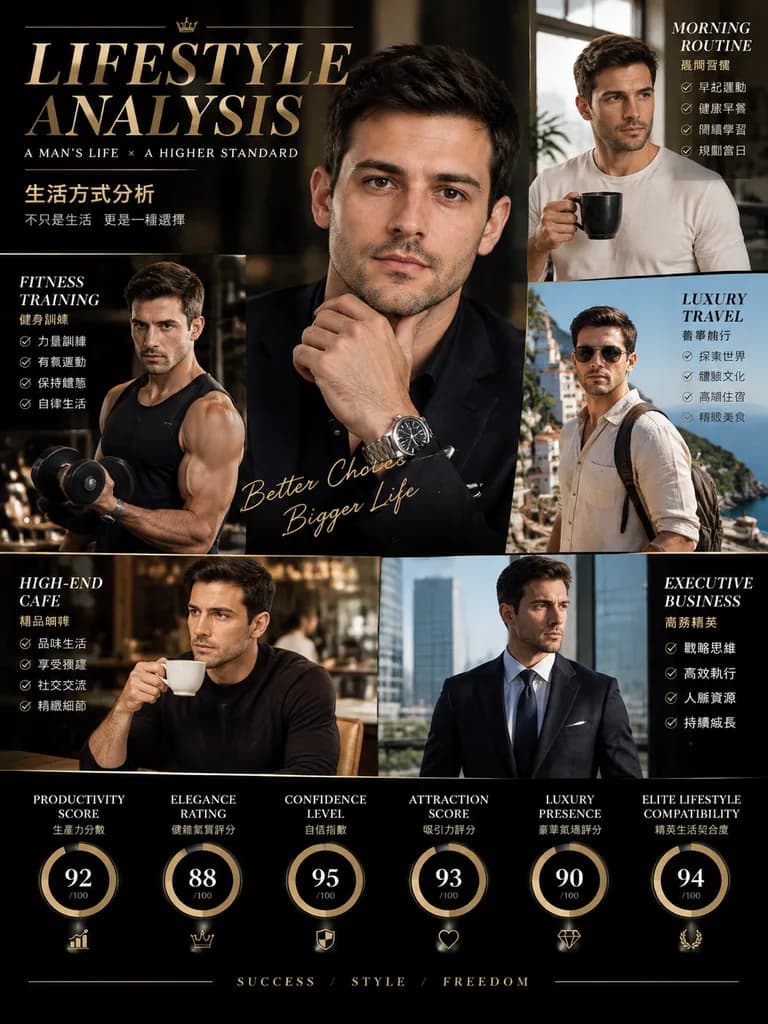
A luxury editorial infographic poster titled "[LIFESTYLE ANALYSIS]" featuring the man from the reference photo with consistent facial identity across multiple scenes. Layout: magazine-style multi-panel composition combining a main portrait and full-body views showcasing [morning routine, fitness training, luxury travel, high-end cafe aesthetic, and executive business lifestyle]. Graphic elements: integrated rating meters, statistics, and text callouts for [Productivity Score, Elegance Rating, Confidence Level, Attraction Score, Luxury Presence, and Elite Lifestyle Compatibility]. Aesthetic: premium black and gold cinematic color palette, modern high-fashion typography, sleek data visualization accents, and dramatic studio lighting.

infographiceditoriallifestyle
Commercial Storyboard for Premium Snack Campaign

Commercial Storyboard for Premium Snack Campaign

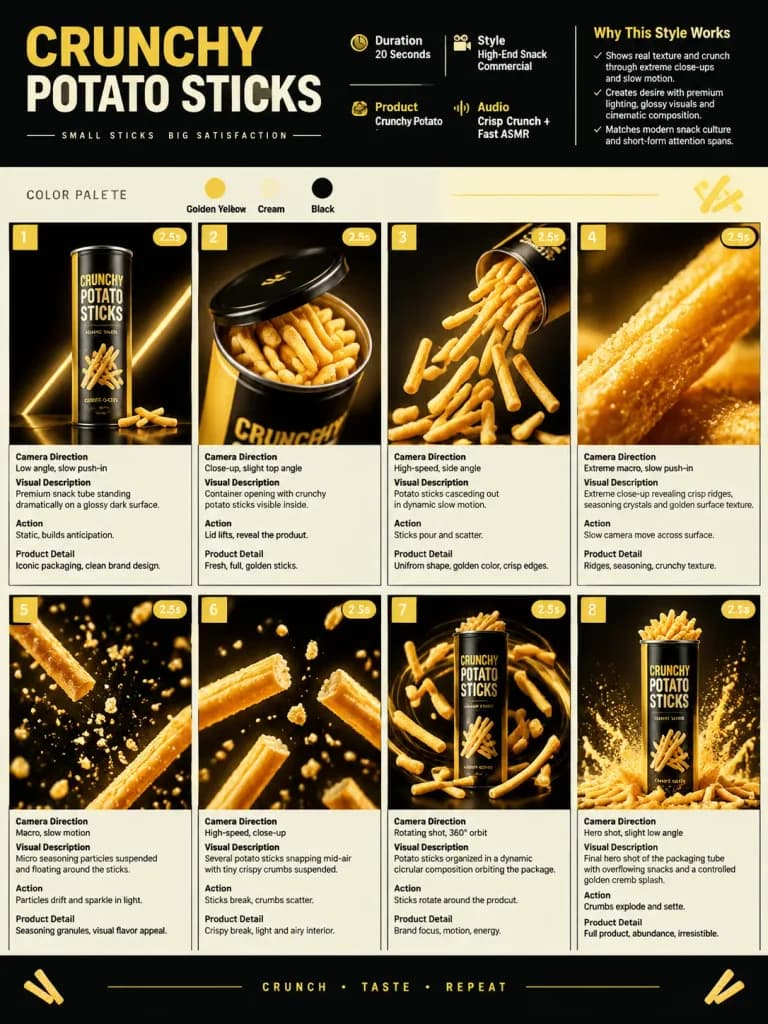
A single-page premium storyboard presentation in 3:4 portrait orientation for a modern snack advertising campaign featuring [Crunchy Potato Sticks]. HEADER: - Bold modern typography - Information badges: Duration: 20 Seconds; Style: [High-End Snack Commercial]; Product: [Crunchy Potato Sticks]; Audio: Crisp Crunch + Fast ASMR - "Why This Style Works" section - Color palette: [Golden yellow, cream, and black] - Minimalist geometric snack-inspired decorative elements STORYBOARD PANELS (8 cinematic product-focused scenes in grid layout): Each panel includes a scene number, duration badge, camera direction, visual description, action, and product detail. 1. Premium snack tube standing dramatically on a glossy dark surface. 2. Container opening with crunchy potato sticks visible inside. 3. Potato sticks cascading out in dynamic slow motion. 4. Extreme macro close-up revealing crisp ridges, seasoning crystals, and golden surface texture. 5. Micro seasoning particles suspended and floating around the sticks. 6. Several potato sticks snapping mid-air with tiny crispy crumbs suspended. 7. Potato sticks organized in a dynamic circular composition orbiting the product package. 8. Final hero shot of the packaging tube with overflowing snacks and a controlled golden crumb splash. STYLE & CAMERA: High-speed studio commercial photography, extreme macro lenses, slow-motion capture, glossy reflections, dramatic rim lighting, sharp studio lighting, ultra-realistic food advertising aesthetic.

storyboardsnackadvertising
Editorial Fashion Blueprint Sheet

Editorial Fashion Blueprint Sheet

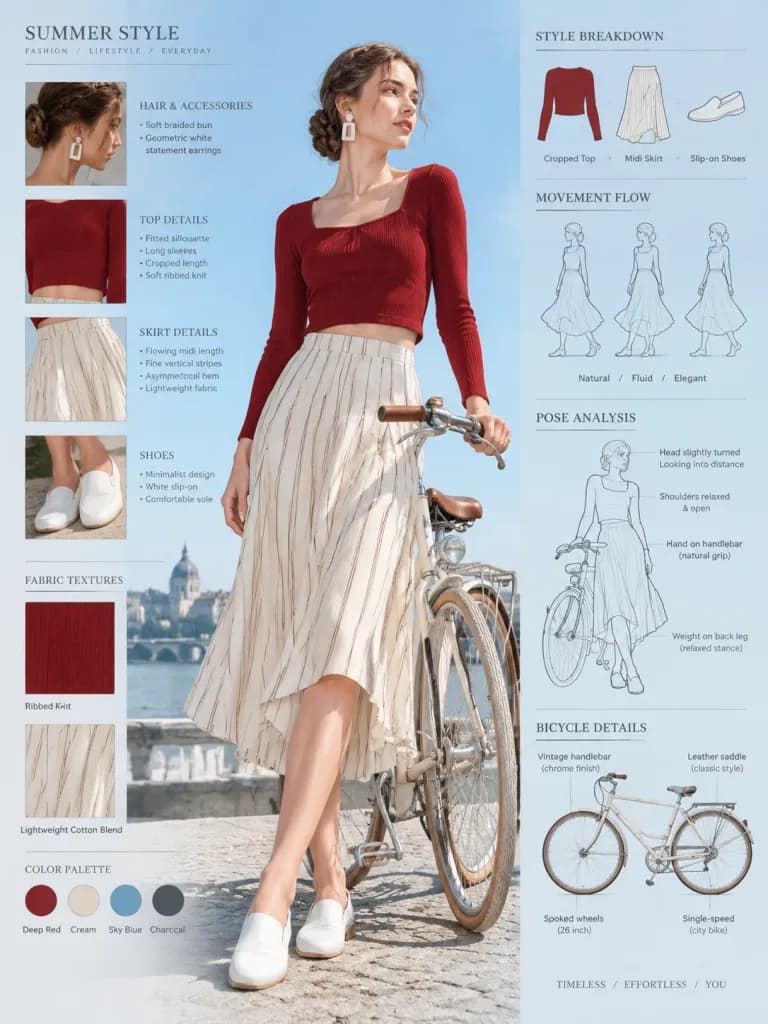
Fashion blueprint concept sheet of an [elegant young woman] posing beside a [vintage bicycle], full-body low-angle shot with detailed outfit annotations, fashion callout labels, and infographic diagrams. The model has hair styled in a soft braided bun, wearing geometric white statement earrings, a fitted deep-red cropped top with long sleeves, a flowing cream striped asymmetrical midi skirt, and white minimalist slip-on shoes, holding the bicycle handlebars in a relaxed pose. Modern European summer aesthetic surrounded by fabric texture notes, bicycle design callouts, movement flow sketches, styling breakdowns, and pose analysis. Bright outdoor daylight, clear blue sky background, editorial lifestyle photography aesthetic.

fashionblueprintinfographic
Bento Grid Medical Science Infographic

Bento Grid Medical Science Infographic

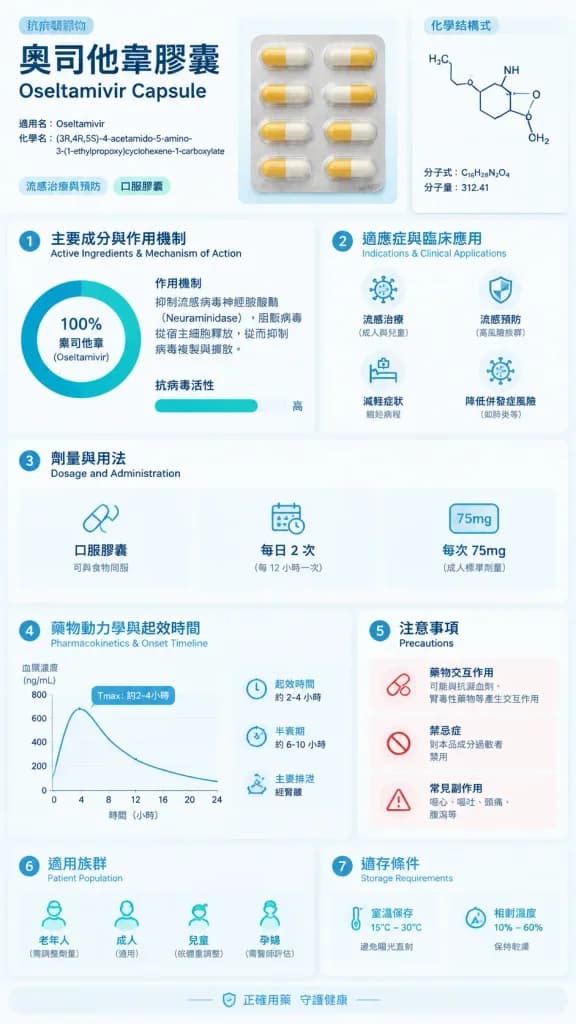
[Oseltamivir Capsule] Science Infographic. Modular Bento Grid Design / Minimalist Medical UI Design. Professional, Clinical, Rigorous, Scientific, Trustworthy. Clinical White. Medical Blue. Slate Grey. Mint Green. A medical science infogra…

infographicbento gridmedical poster
Lime Drug Design Infographic

Lime Drug Design Infographic

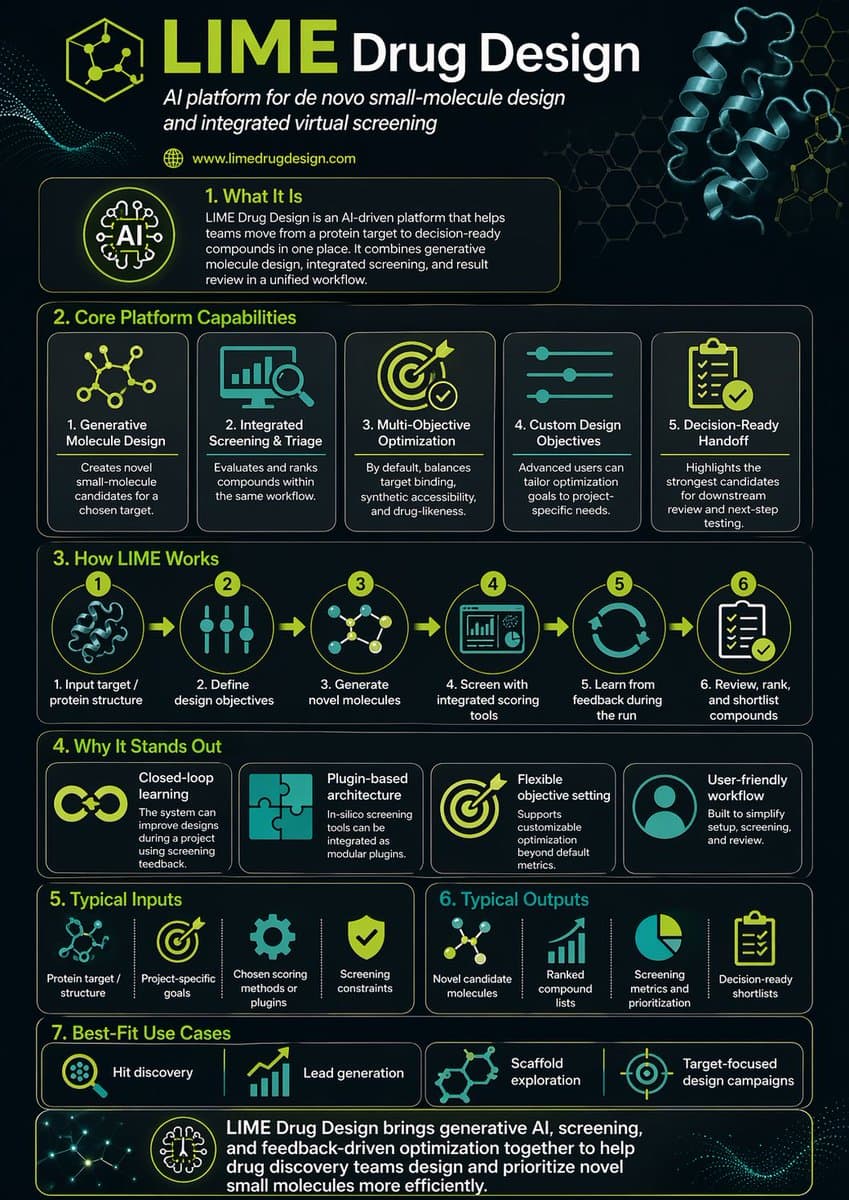
Research LIME Drug Design and make a detailed infographic about it. Include molecular structures, the LIME methodology workflow, key benefits and applications, comparison charts, and relevant statistics. Use a clean scientific layout with proper section hierarchy, molecular diagrams, flowcharts, and a professional color scheme suitable for pharmaceutical research communication.

infographicsciencepharmaceutical
Personal Knowledge Infographic Portrait

Personal Knowledge Infographic Portrait

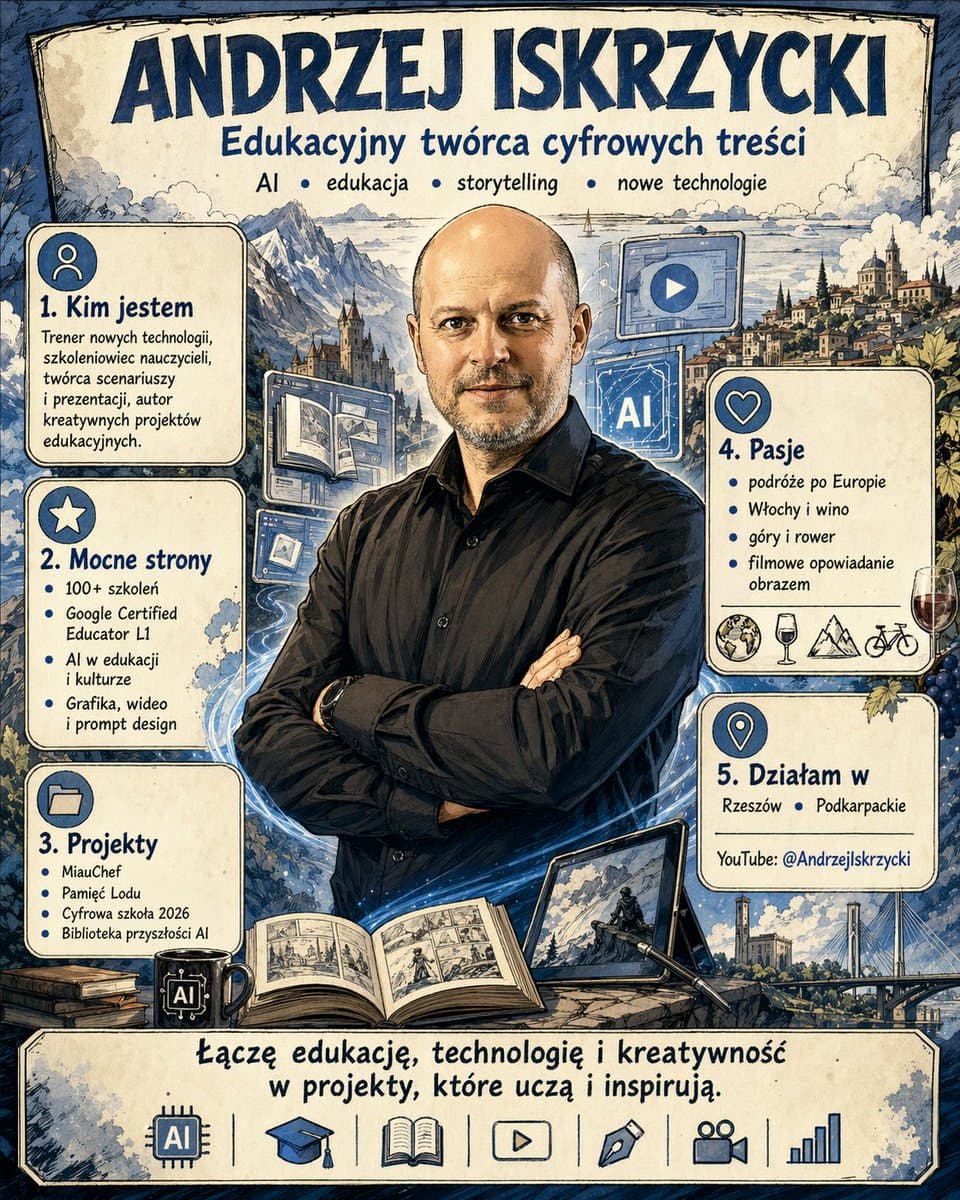
Knowing everything you know about me, create an infographic of me. Make an image in cartoon anime style. Include a stylized character portrait, key attributes, skills, personality traits, and interests organized in an attractive infographic layout with anime-inspired visual elements, icons, and decorative frames.

infographicanimepersonal branding
Personal Profile Infographic

Personal Profile Infographic

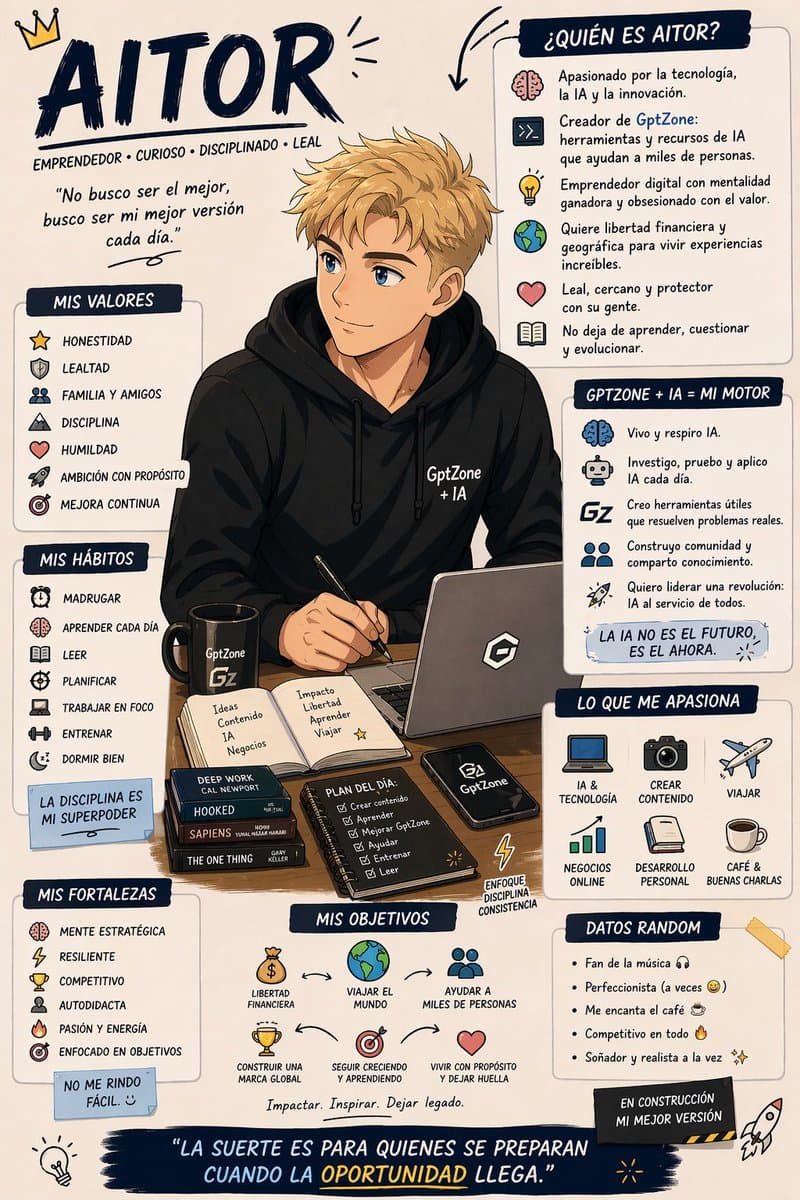
Use everything you know about me and create an infographic representing me. Do it in Franco-Belgian comic book style. Include character illustration, key personality traits, skills, interests, and fun facts arranged in an engaging infographic layout with comic-style panels, speech bubbles, and decorative elements. The overall design should feel like a character introduction page from a European graphic novel.

infographicpersonal brandingcomic style
Science Encyclopedia Vertical Poster

Science Encyclopedia Vertical Poster

Generate a high-quality vertical science popularization encyclopedia image based on [Theme]. Include a clear beautiful main visual, several detail close-ups, multiple rounded modular information sections, clear title hierarchy with emphasis labels, concise but rich encyclopedia content, and visual scoring or Top 5 summary modules. Light clean background, soft colors, subtle shadows, refined small icons, rounded information boxes, neat layout. Information-dense but not crowded, like a real publishable, collectible science encyclopedia card, not an advertisement.

posterinfographicscience
Naturalist Food Specimen Cross Section

Naturalist Food Specimen Cross Section

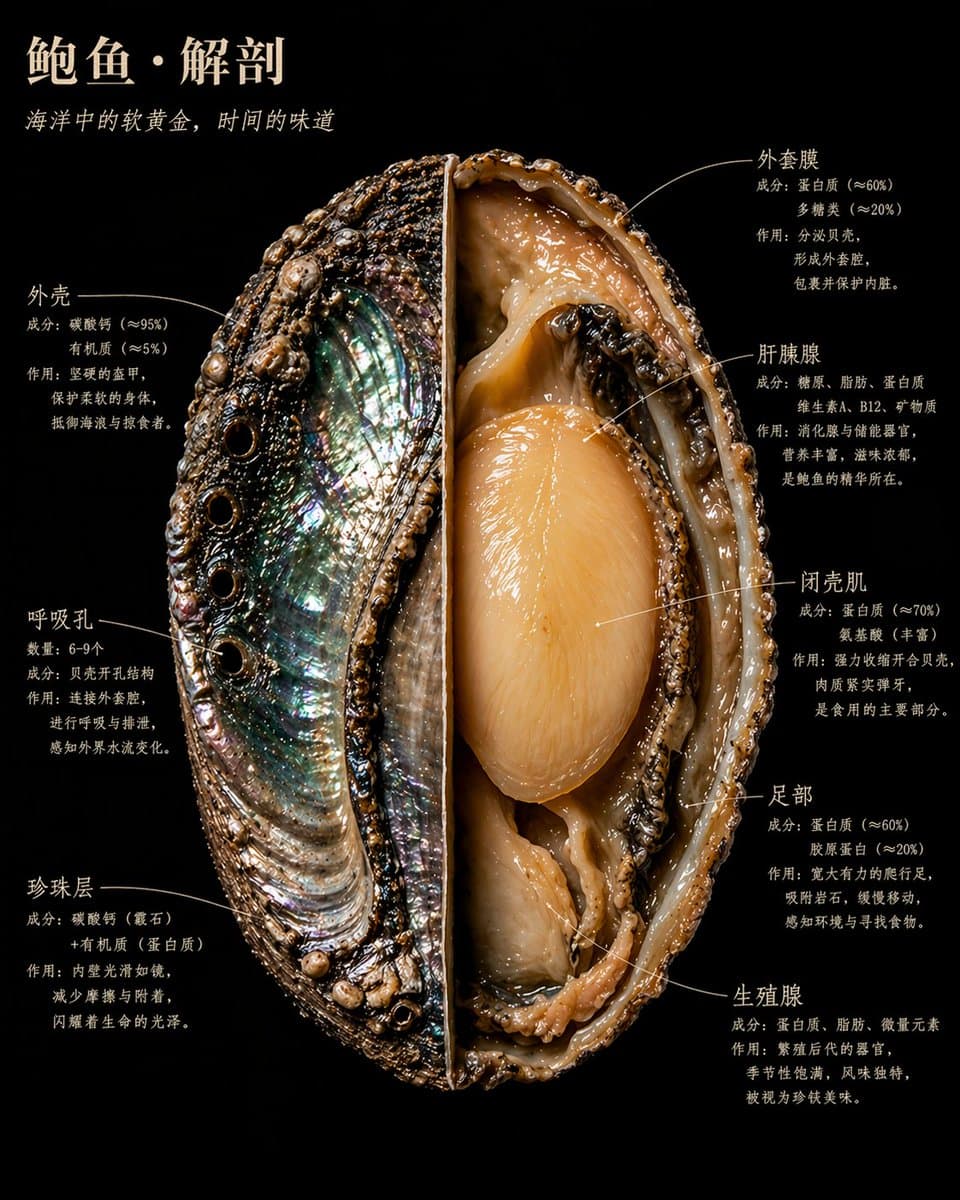
A food specimen dissected and displayed like a museum naturalist discovery. One half preserves the outer surface with its natural texture and color; the other half is cut to the core, revealing the internal structure in sharp detail. The background is pure black velvet. The food floats in the frame like something precious and dangerous. Annotated labels hug the structural edges in handwritten serif typography, never floating. Each annotation has three lines: structure name, composition data, and a plain-language explanation. Main title in warm ivory uppercase at the top-left. Overall aesthetic: Audubon naturalist illustration meets Caravaggio lighting meets the most beautiful scientific photography ever made. 4K precision, specimen lighting, extreme internal detail. Realistic style, not diagram, not cartoon. Every material has true physical texture: rough, smooth, wet, dry, dense, porous.

naturalistfood photographyscientific illustration
Character Relationship Map Poster

Character Relationship Map Poster

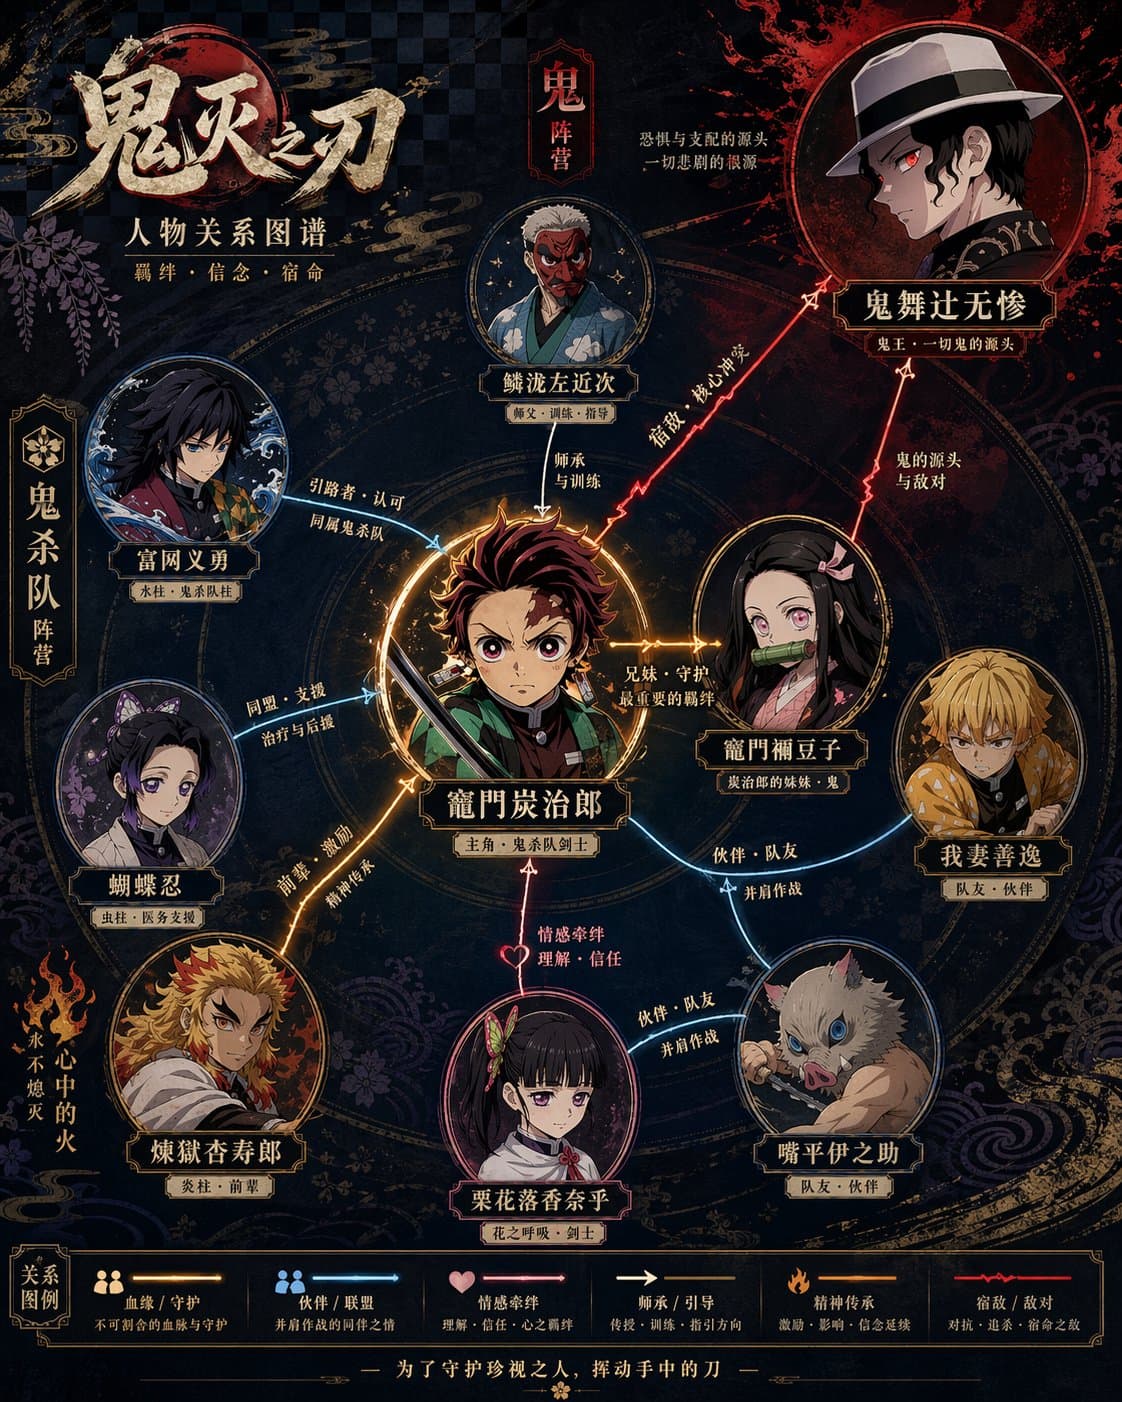
Generate a high-design character relationship map poster based on the given theme. Include portraits of the main characters, name labels, relationship connection lines between characters, and relationship descriptions. The overall layout should be clear and layered, with a harmonious color palette and refined typography — information-dense yet never feeling crowded. The style combines modern infographic design with cinematic movie poster aesthetics.

relationship mapinfographiccharacter design
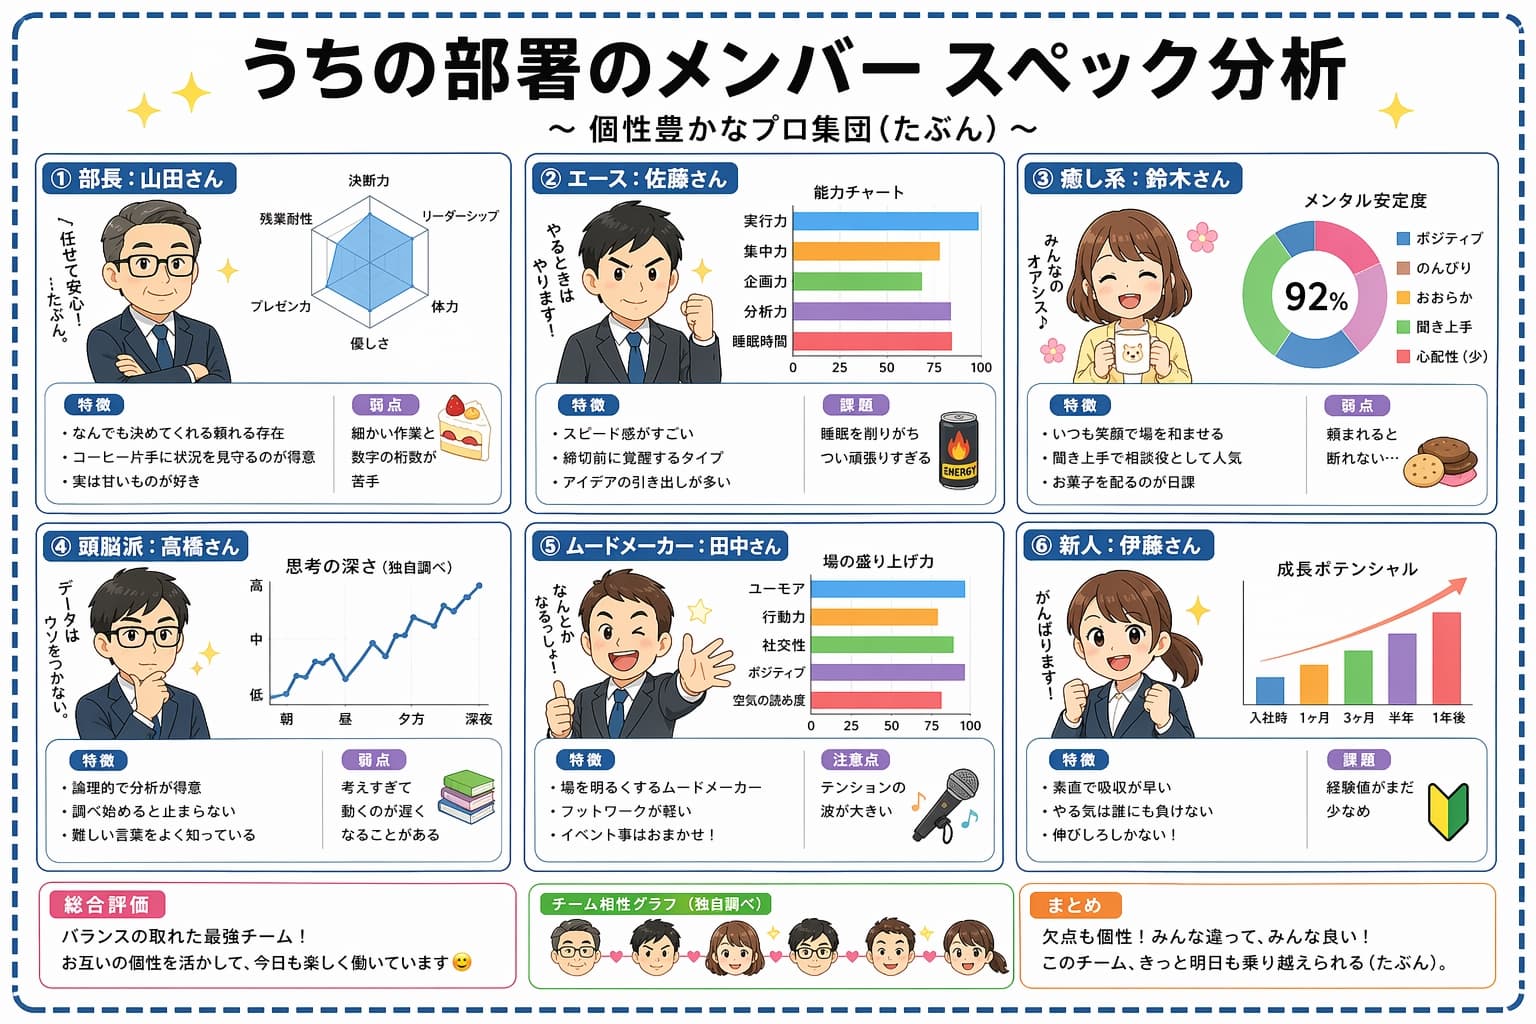
Japanese Team Analysis Infographic

Japanese Team Analysis Infographic

Create a Japanese-language infographic titled "うちの部署のメンバー スペック分析" (Our Department Member Spec Analysis) with subtitle "個性豊かなプロ集団(たぶん)". Layout as a 2x3 grid of six member cards on a clean white background with pastel accents and star decorations. Each card features a cute chibi-style cartoon avatar and includes: member name and role in Japanese, a radar chart or bar chart showing their stats, bullet-point strengths and weaknesses in Japanese. Add a summary section at the bottom with overall team evaluation, a team compatibility graph placeholder, and a final takeaway note. Cheerful office illustration style, soft rounded UI elements, kawaii aesthetic, highly legible Japanese typography, no watermark.

infographicJapanese textdata visualization
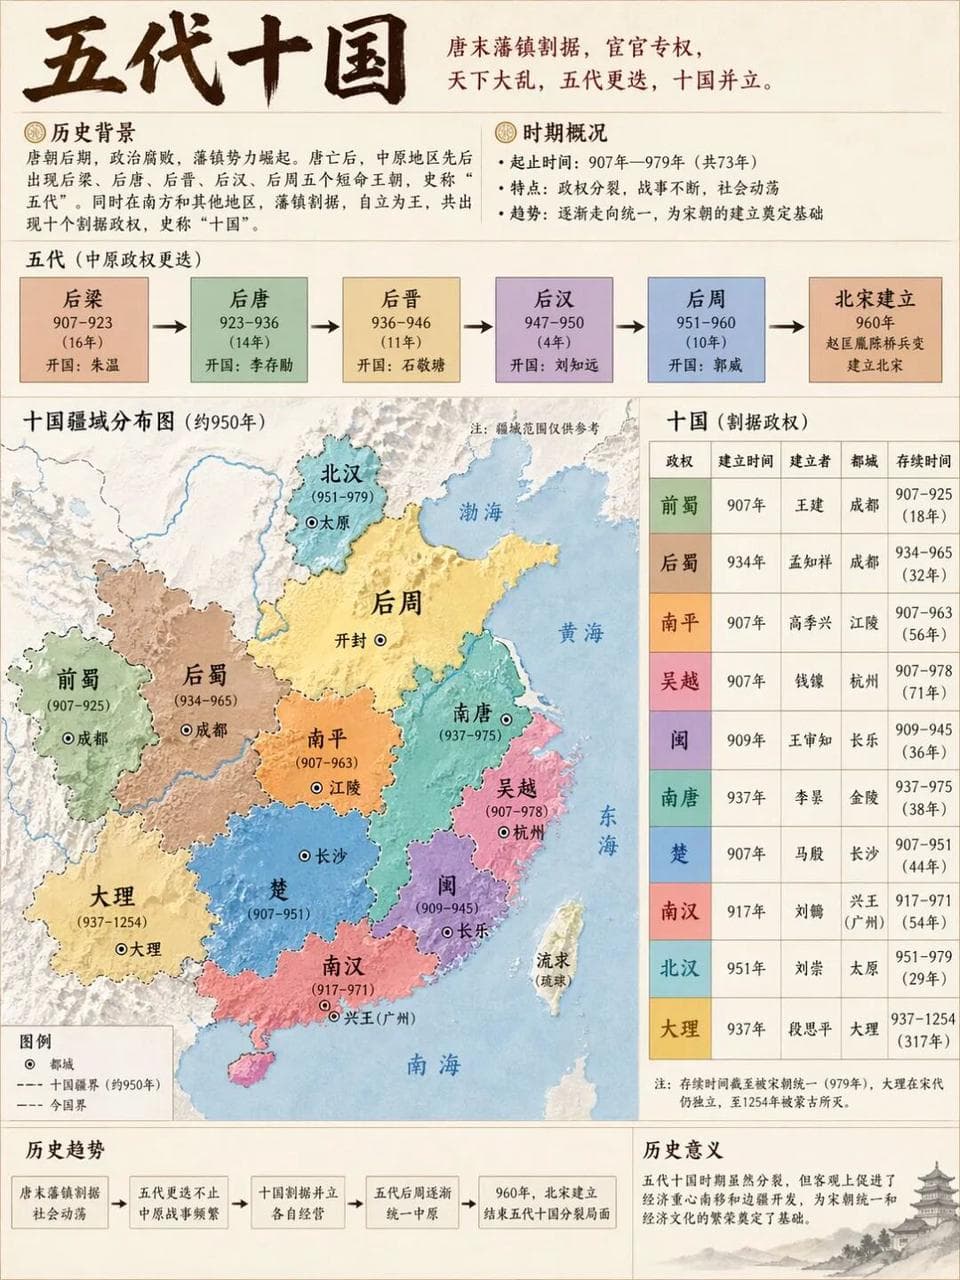
Five Dynasties and Ten Kingdoms

Five Dynasties and Ten Kingdoms

Generate a historical demonstration map of [Five Dynasties and Ten Kingdoms] to ensure accurate and clear information, 3:4, 4k

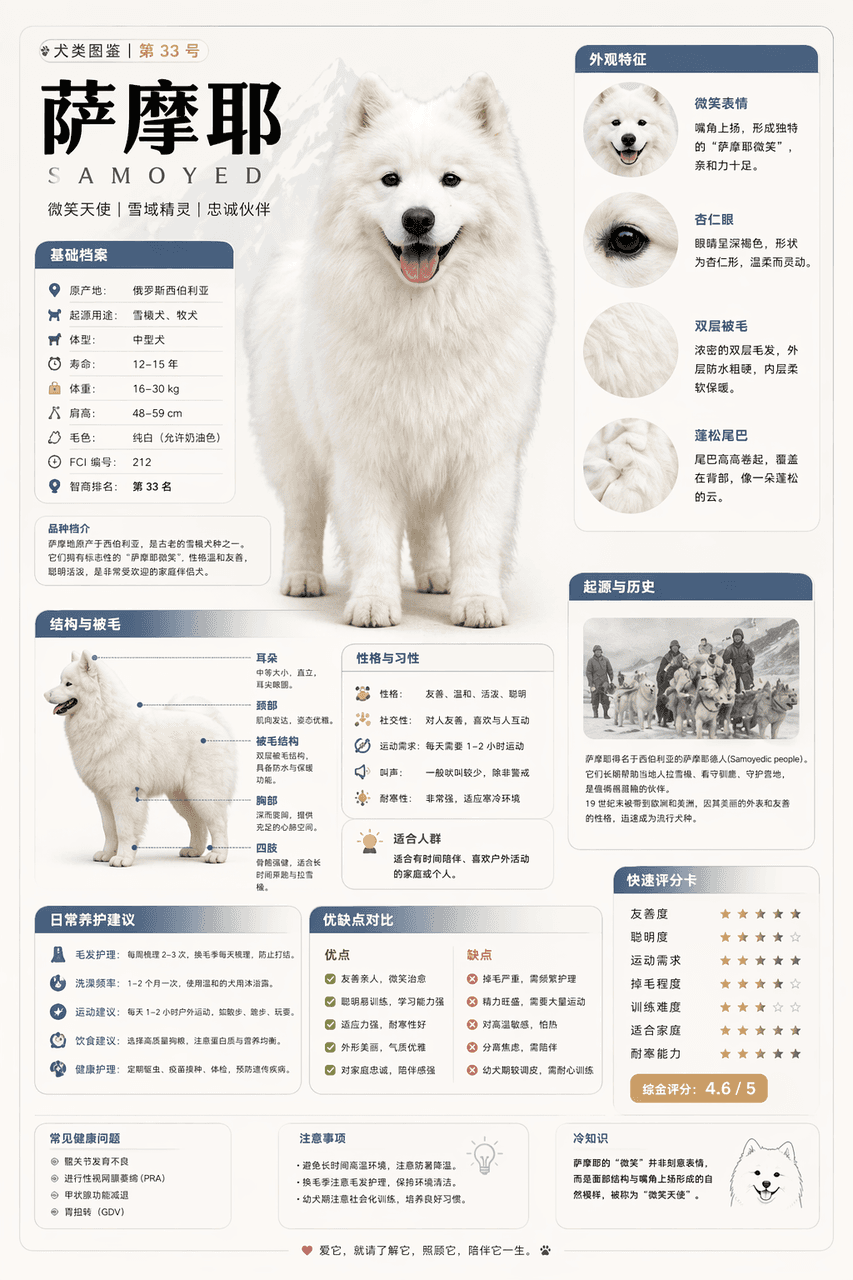
Modular Encyclopedia Infographic

Modular Encyclopedia Infographic

Please generate a high-quality vertical "popular science encyclopedia map" based on [Samoyed]. This picture is not an ordinary poster, nor is it a simple illustration, but a modular science information map that has a "picture book feel, an encyclopedia feel, a sense of information structure, and a sense of collection". The overall style refers to the combination of advanced natural history illustrations, modern encyclopedia pages, lifestyle knowledge cards and social media high-dissemination information graphics. Please make the screen contain: A clear and beautiful theme main vision Several local features enlarge details Multiple rounded corner modular information partitions Clear title hierarchy and key labels Concise but rich encyclopedia content Visual scoring, summary of key points or Top 5 modules The content columns should be automatically adapted according to the theme, giving priority to choosing from these directions and combining them appropriately: Basic files, classification information, appearance characteristics, habits/ecology, formation mechanism/structural composition, growth or use conditions, care or maintenance suggestions, risks and precautions, suitable people or applicable scenarios, comparison of advantages and disadvantages, and quick score card. Visual requirements: Light and clean background, soft colors, light shadows, exquisite small icons, rounded information boxes, neat layout, high information density but not crowded, good reading experience. The whole thing must look like a popular science encyclopedia card that can be truly published, read, collected, and serially produced, rather than an advertising image. Please do not make it into an ordinary commercial poster. It is necessary to highlight the characteristics of "knowledge organization + module information + illustrated display". (Refer to X knowledge diagram)

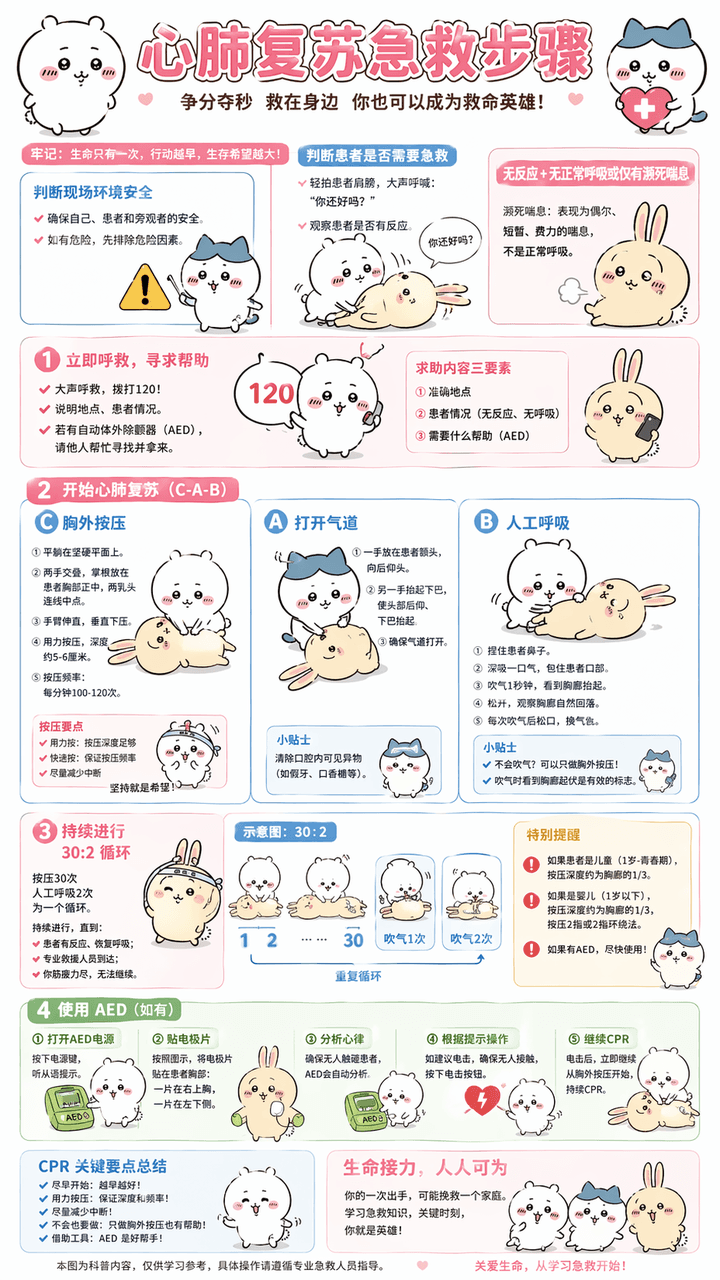
Cardiopulmonary Resuscitation Explanation Chart

Cardiopulmonary Resuscitation Explanation Chart

Generate "cardiopulmonary resuscitation first aid steps" explanation diagram, replace technical vocabulary with popular vocabulary, Chinese dialogue, use Chiikawa as the overall image guide, pure Chinese, information must be sufficiently detailed and accurate, ratio 9:16, 4k Compared to nano banana pro, I think the character image is a bit blurry, as are the small fonts.

Handbook collage

Handbook collage

You are good at deconstructing complex knowledge and using the art of "Scrapbook Collage" to transform it into visual information graphics that are both educational and healing.

Illustrated Workout Infographic Chart

Illustrated Workout Infographic Chart

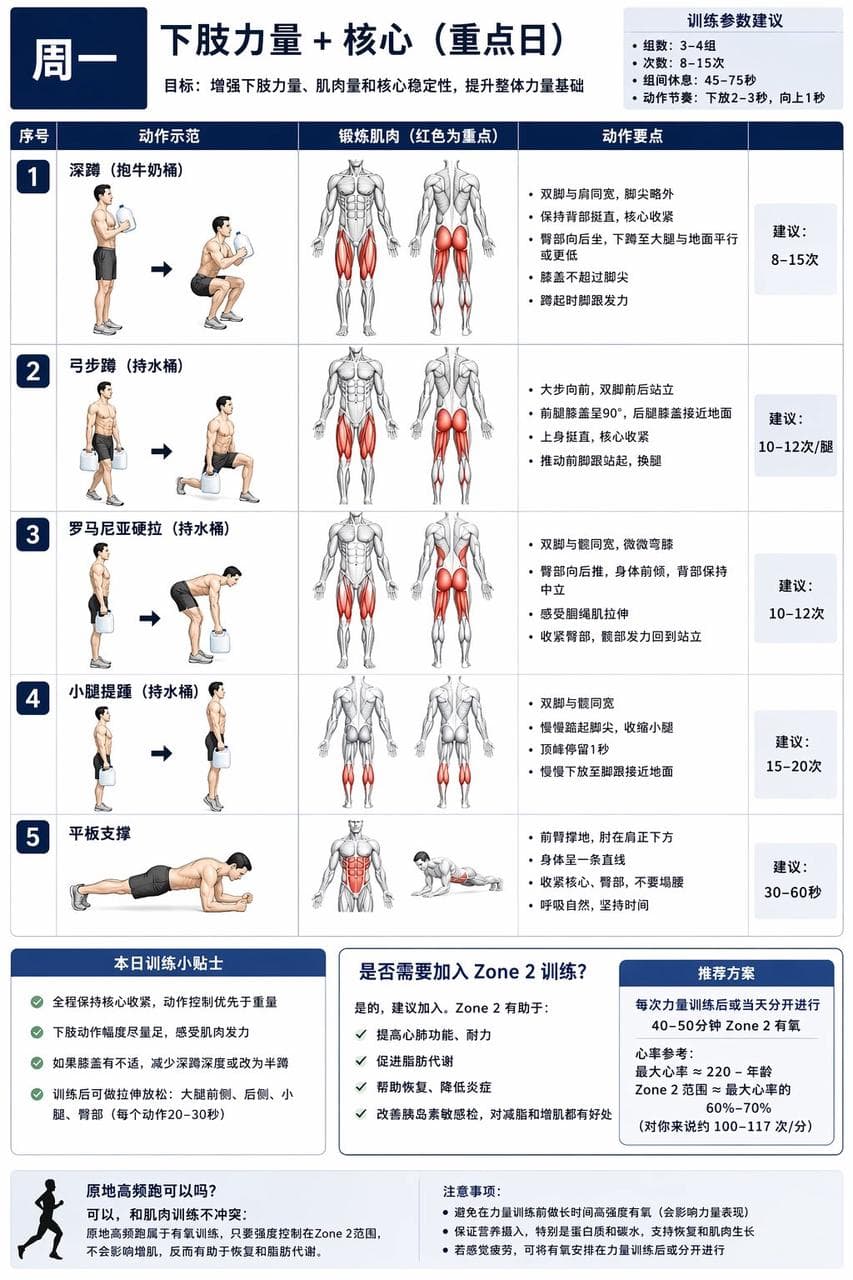
For XX-year-old me, I have developed instructions and diagrams for a comprehensive muscle-building training plan that can be completed at home with no equipment or with a small amount of equipment. I (the following are my special requirements. You can modify them yourself) currently use 1-gallon milk bucket water instead of dumbbells. The water can be filled or not filled to meet the different requirements of beginners. I also have a set of fitness elastic bands. The training cycle is a weekly cycle, and different parts need to be trained every day. There must be rest days or staggered training to avoid excessive fatigue of muscles in a certain area and affecting the training effect. It requires a focus on core and lower body strength, abdominal muscles, chest muscles, as well as shoulders and upper arms. First generate a general chart, and then generate separate daily training plan charts according to my instructions. Instead of using realistic photos for the characters in the picture, use illustrations of muscular men commonly seen in fitness charts. In the illustrations, the muscles being exercised are represented in red.

Building disassembly diagram

Building disassembly diagram

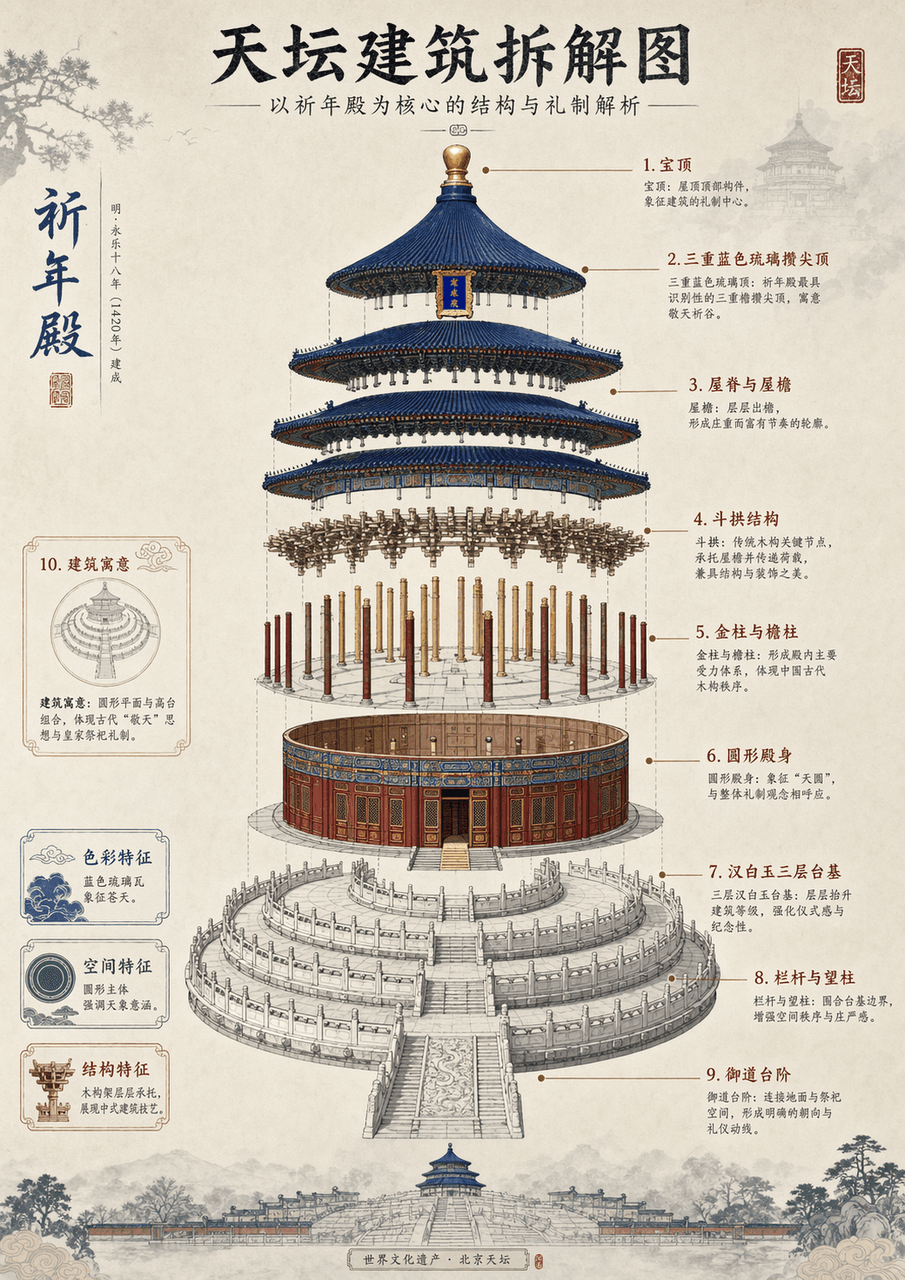
Generate an architectural disassembly diagram of (Temple of Heaven, **Eiffel Tower**) with detailed instructions and Chinese aesthetic style

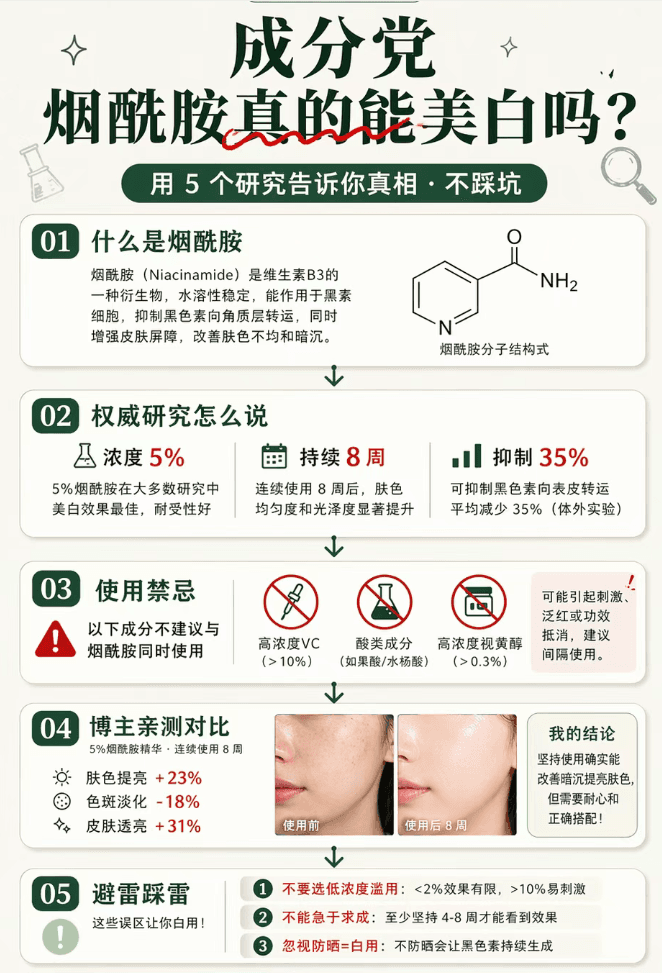
Prompt 06

Prompt 06

A long picture of popular science about skin care ingredients in the style of Little Red Book, with a vertical format of 9:16 (suitable for long picture note covers). The overall sense of rigorous science popularization: off-white background + dark green main color + red for data emphasis. The big title at the top is "Ingredients/Can Niacinamide Really Whiten?" (serif bold dark green + "Really" is crossed by a red wavy line to imply the inversion) + subtitle "Use 5 studies to tell you the truth · Don't step on the trap." The main body below is an arrangement of popular science cards: ① "What is nicotinamide" card (white background with rounded corners + an explanation of about 50 words + a schematic diagram of the structure of a small molecule next to it); ② "What does authoritative research say" card (3 key points of research data: concentration 5%/8 weeks/inhibition 35%); ③ "Usage Contraindications" card (red warning mark + 3 ingredients that cannot be combined); ④ "Blogger Personal Test Comparison" card (before and after skin photos + brief conclusion); ⑤ "Lightning Protection and Lightning Protection" card (marked with 3 points including "Do not choose low concentration abuse"). There are connecting symbols (downward arrows/dividers) between each card. The "Follow to Unlock More" card at the bottom + blogger information + "Full Ingredient List → Click on the homepage" guide. The overall popular science feel is compatible with the aesthetic of Xiaohongshu. The information density is extremely high but the structure is clear. The picture ratio is 9:16.

Prompt 01

Prompt 01

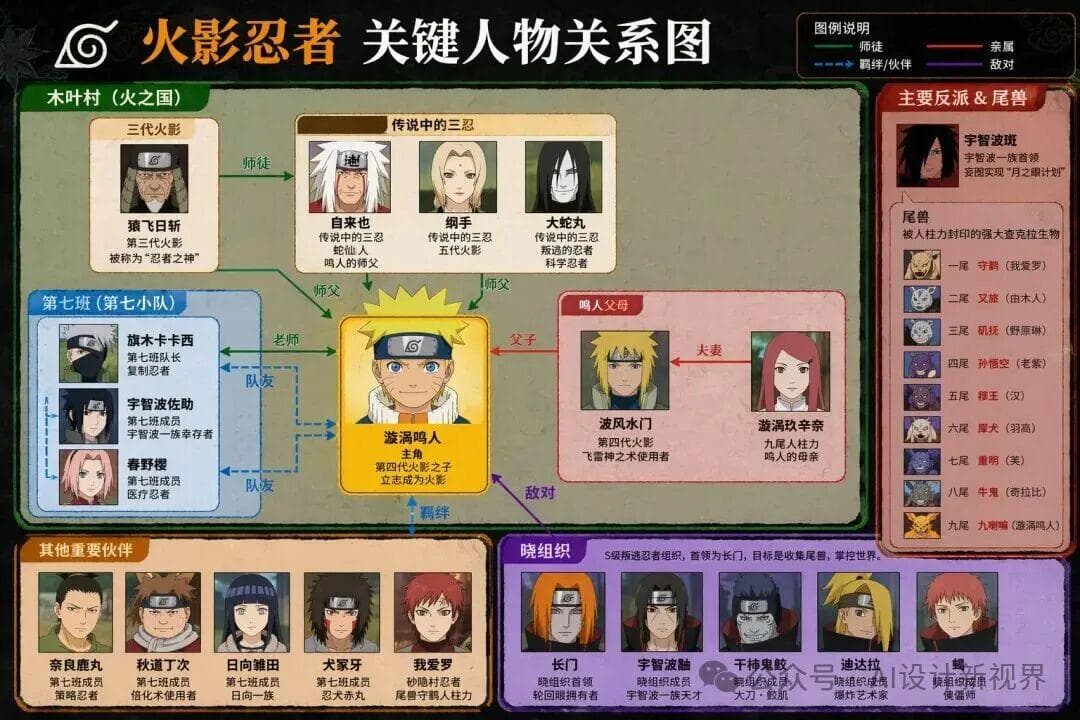
Please generate the key person relationship diagram of "XXX"

Daydreaming #47

Daydreaming #47

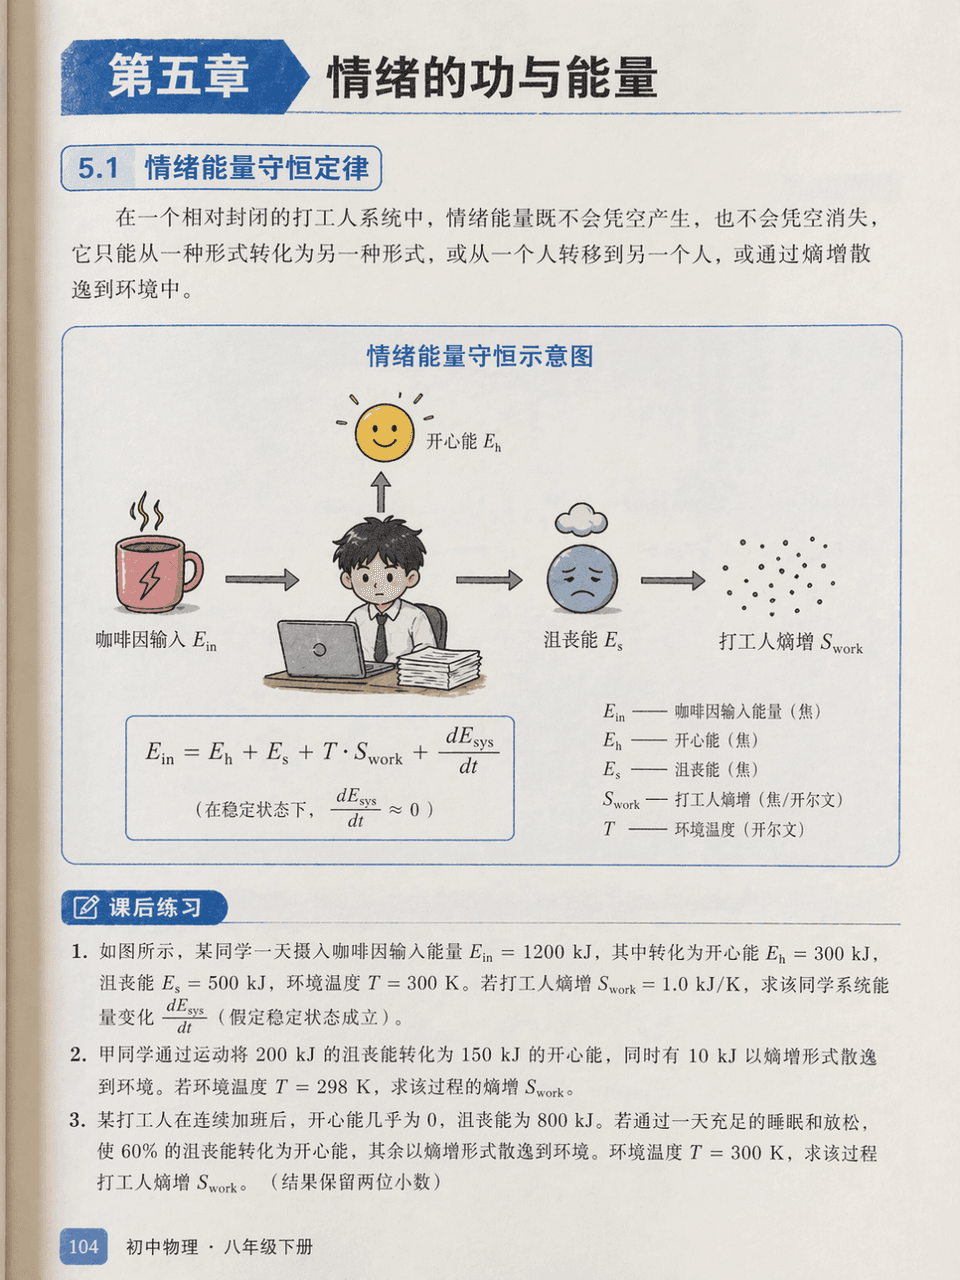
Prompt words: Draw an illustration page from a junior high school physics textbook, chapter "Chapter 5: Work and Energy of Emotions". There is a serious energy conservation diagram but the labels are "happy energy", "frustration energy", "caffeine input" and "worker entropy increase". The three after-class exercises below are serious.

Cute Picture Book #29

Cute Picture Book #29

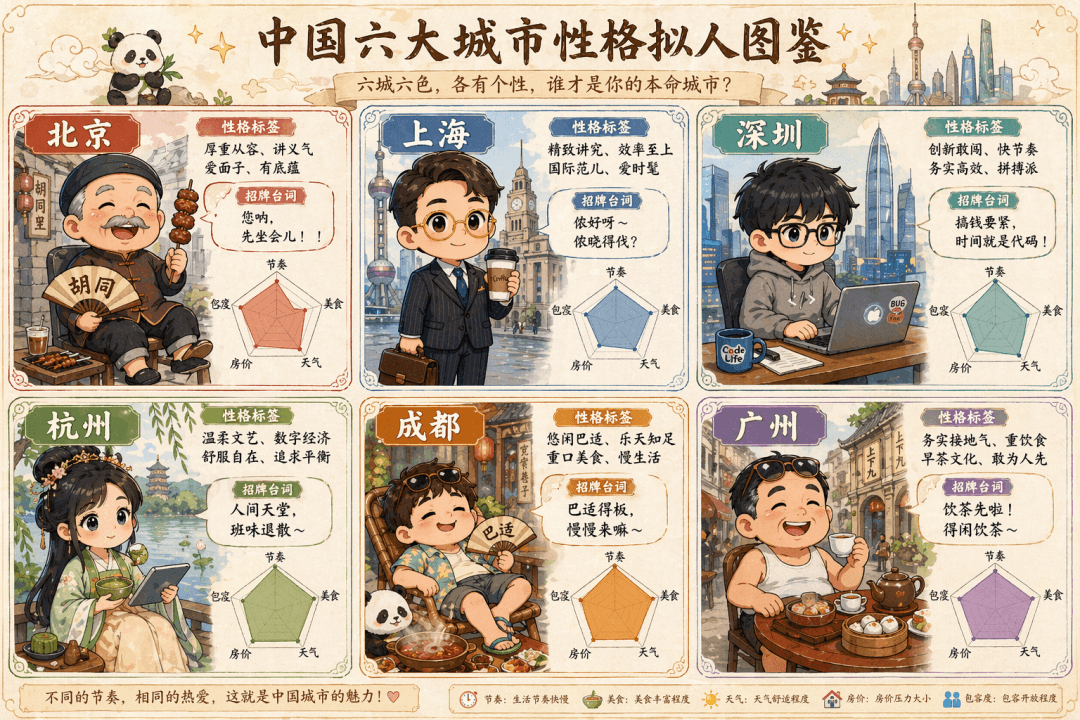
The prompt is to draw a cute hand-painted "Anthropomorphic Illustration of Characters in Six Big Cities in China". The six Q-version villains in the six-square grid represent Beijing (the old man in the alley wearing a Tang suit wearing strings), Shanghai (the elite white-collar worker with gold-rimmed glasses holding a coffee), Shenzhen (the programmer in a sweatshirt holding a notebook), Hangzhou (the girl in Hanfu holding matcha and a tablet), Chengdu (half-lying in shorts and flip-flops around a hot pot), and Guangzhou (Lao Guang drinking morning tea in flip-flops). Each grid is equipped with a personality label, signature lines, and a radar chart (five dimensions: rhythm, food, weather, housing prices, and tolerance), and the whole is like an elf guide.

Cute Picture Book #28

Cute Picture Book #28

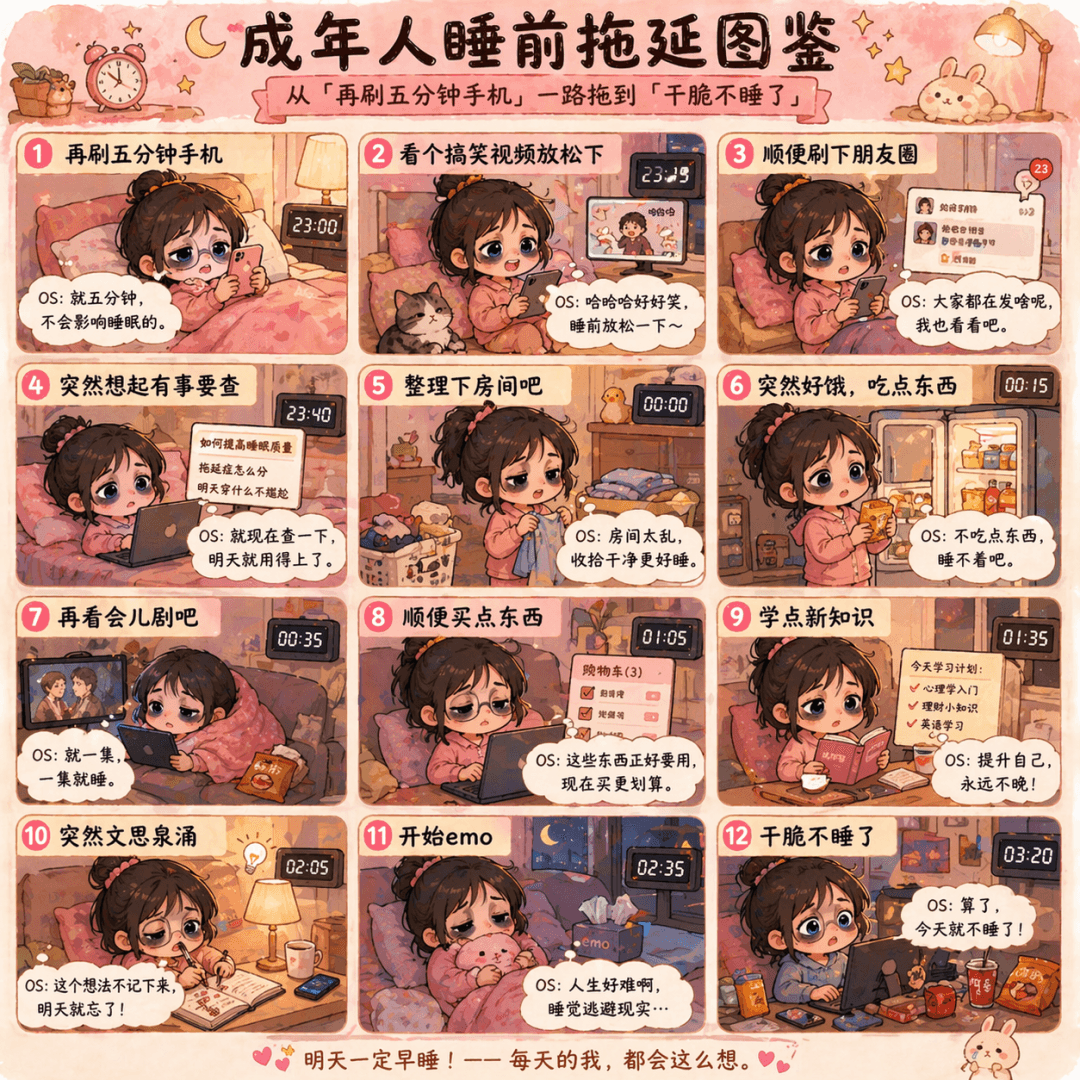
The prompt is to draw a Q-version cartoon of "Bedtime Procrastination Illustrated Guide for Adults", with the zodiac grid dragging from "check the phone for another five minutes" to "don't sleep at all". Each frame has a small black-eyed doll and a heartfelt OS message, in pink and warm yellow colors.

Cute Illustrated Book #27

Cute Illustrated Book #27

The prompt is to draw an eight-square Q version illustration of "Programmer Debug Behavior Illustration". A situation in each cell includes "Restart and try", "Delete and rewrite", "Ask ChatGPT", "Worship the code god", "Doubt the hardware", "Dump the colleague", "Drink coffee to calm down" and "Go home and sleep". Each cell is equipped with a line of complaining text.

Cute Picture Book #26

Cute Picture Book #26

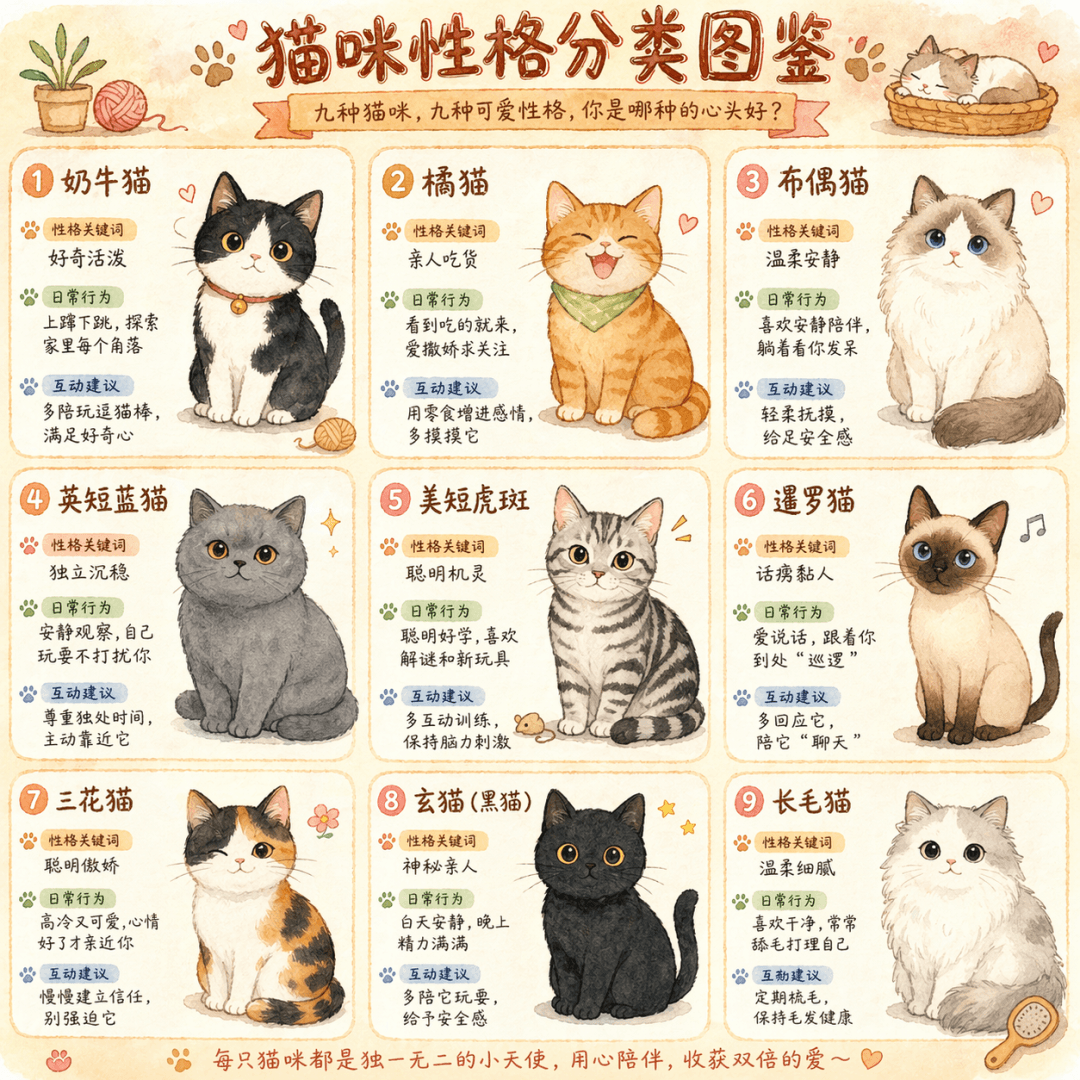
The prompt is to draw a cute hand-drawn infographic called "Cat Personality Classification Illustration", with nine different colors of cats in a nine-square grid. Each box is equipped with a personality keyword, daily behavior description, and interactive suggestions, in a warm watercolor style.

Cute Picture Book #25

Cute Picture Book #25

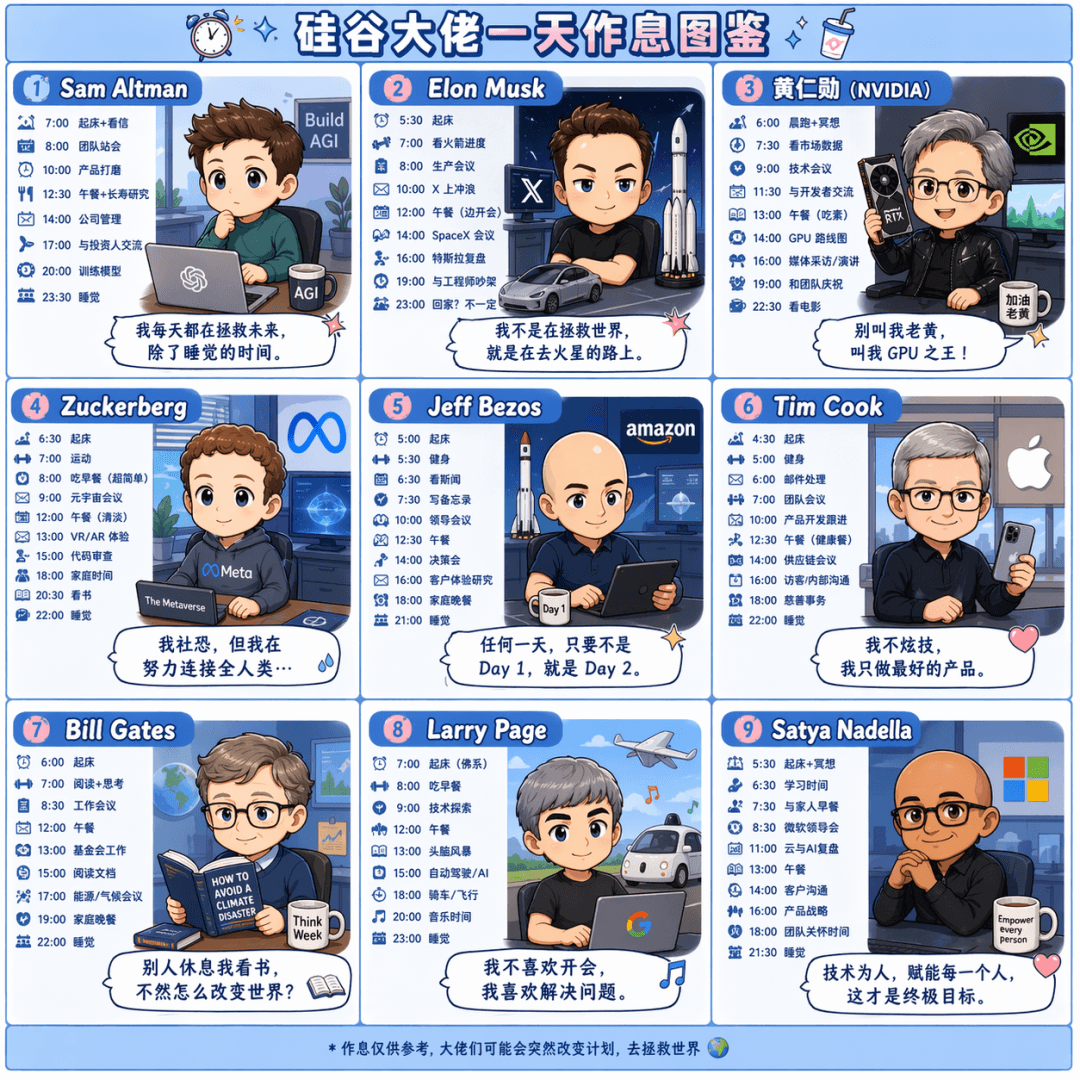
The prompt is to draw a Q-version cartoon nine-square grid called "A Day's Workbook of Silicon Valley Bosses". Draw the daily schedules of Sam Altman, Elon Musk, Jen-Hsun Huang, Zuckerberg, Jeff Bezos, Tim Cook, Bill Gates, Larry Page, and Satya Nadella respectively. Each box is equipped with a time and a comment dialog box, in pink and blue colors.

Strategy long picture #5

Strategy long picture #5

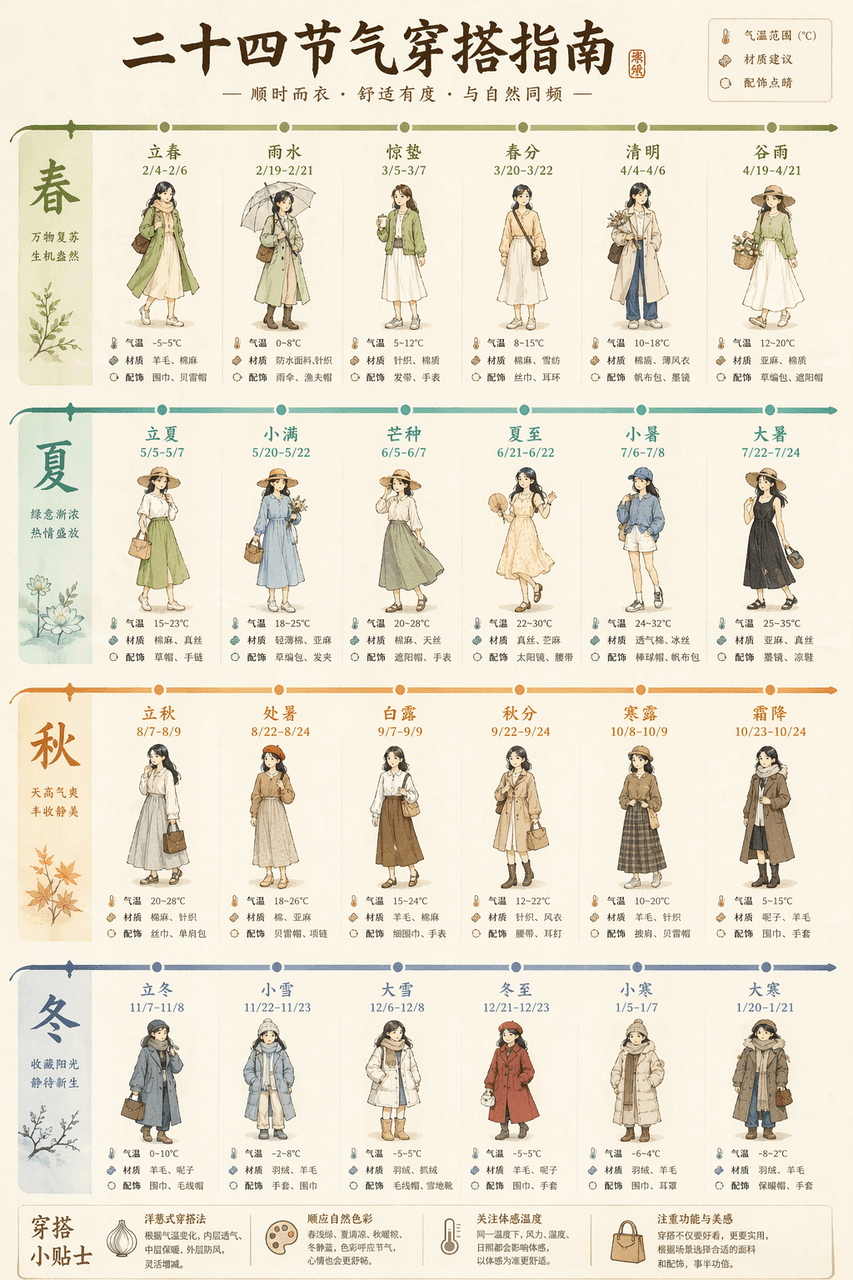
Draw a long picture "Guide to Outfits for the Twenty-Four Solar Terms", with a horizontal timeline running through the whole picture. For each solar term, a small puppet shows the outfit for that day, with temperature ranges, material recommendations, and accessories highlighted. Light beige base with twenty-four gradient colors.
Strategy long picture #4

Strategy long picture #4

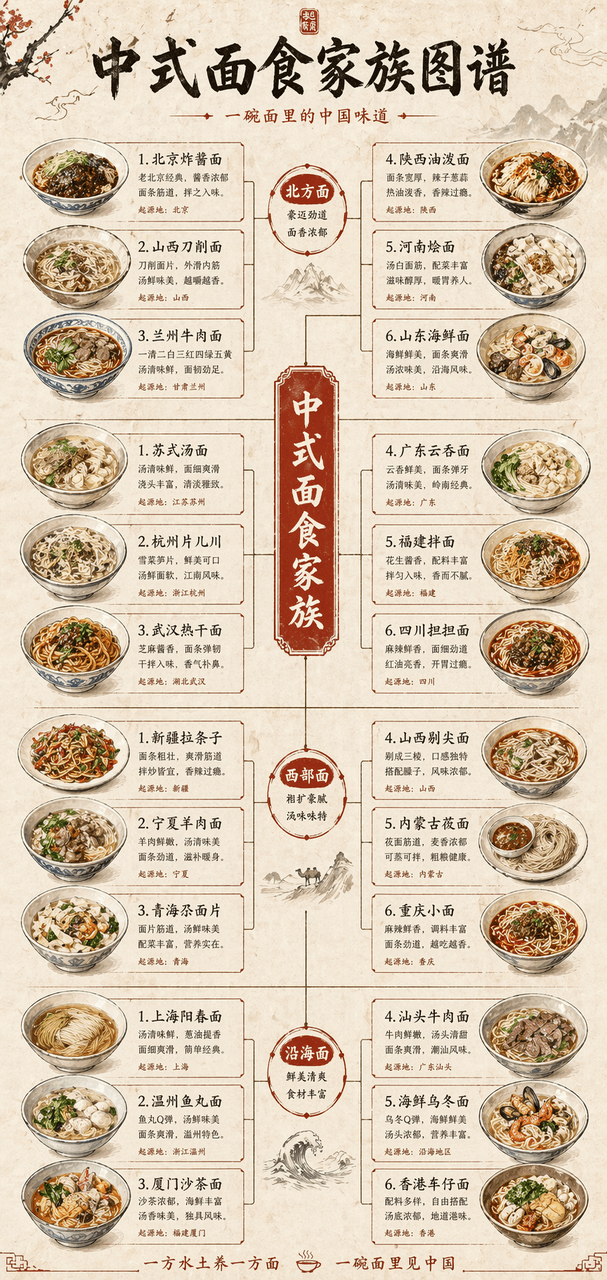
Draw a long vertical picture of the "Chinese Noodle Family Tree", showing the four branches of northern, southern, western and coastal noodles like a family tree. Each branch extends to five to six kinds of noodles, with hand-drawn illustrations of noodle bowls. The rice paper background is decorated with vermilion.

Strategy long picture #3

Strategy long picture #3

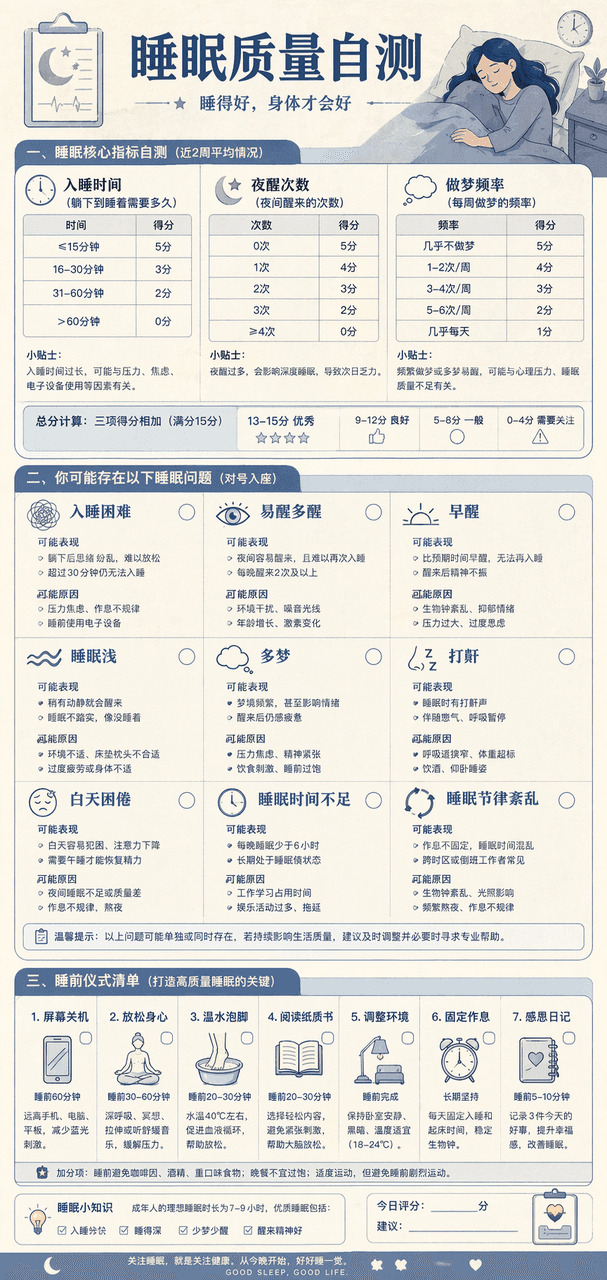
Draw a "Sleep Quality Self-Assessment Chart". At the top are three self-assessment tables, including the time it takes to fall asleep, the number of night awakenings, and the frequency of dreams. In the middle, nine common sleep problems are listed, and at the bottom is a list of pre-sleep rituals. The Morandi blue color scheme resembles the design of a medical examination report.

Strategy long picture #2

Strategy long picture #2

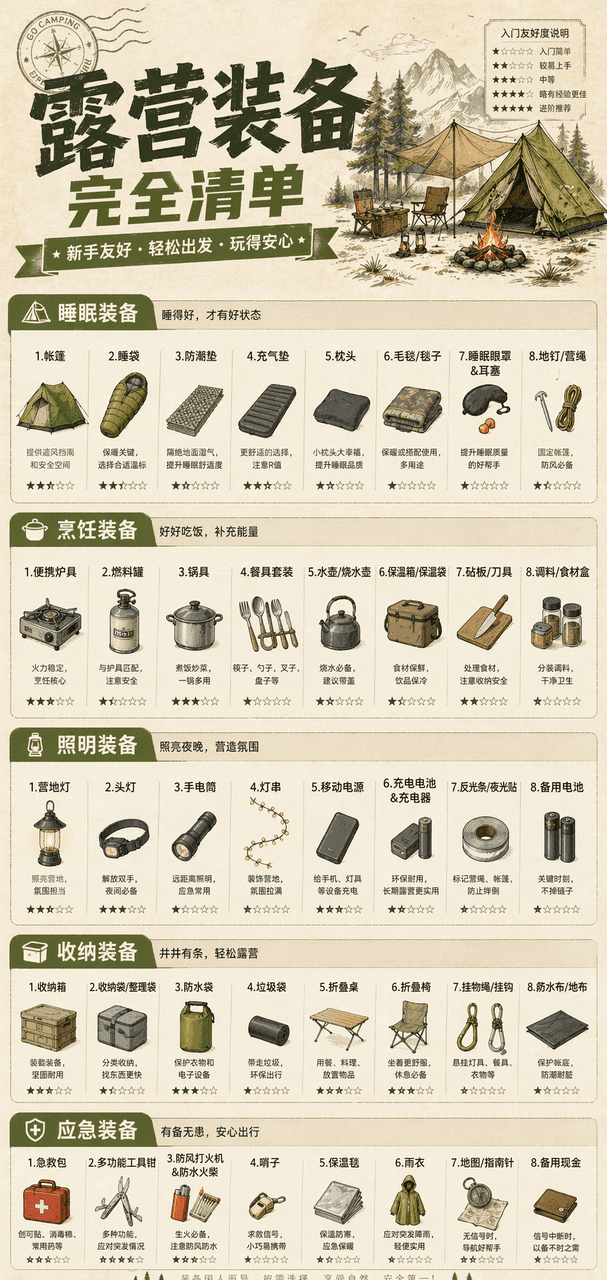
Draw a vertical "Complete List of Camping Equipment" infographic, divided into five modules: sleeping, cooking, lighting, storage, and emergency. Each module lists seven to eight specific pieces of equipment, with small icons and entry-friendliness stars. Khaki green main color, paper texture background.

Strategy Long Picture #1

Strategy Long Picture #1

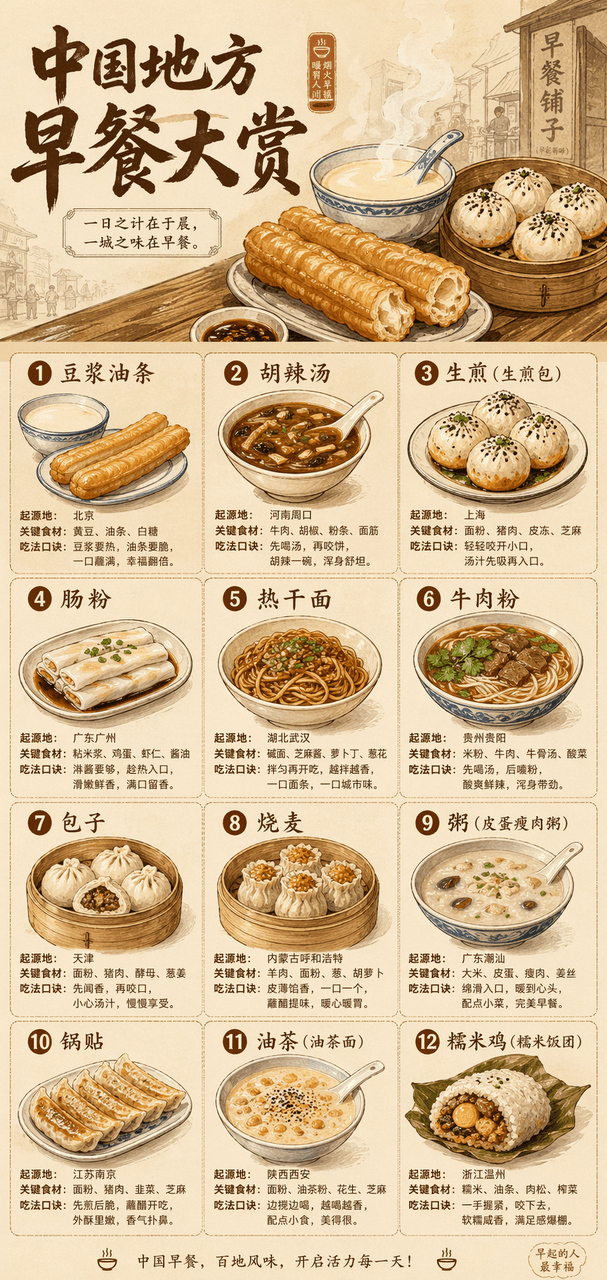
Draw a long vertical picture with the theme "China Regional Breakfast Awards". The large title at the top is accompanied by a steaming hand-drawn illustration, and a grid is used below to display twelve types of breakfast, including soy milk fried dough sticks, spicy spicy soup, fried noodles, rice rolls, hot dry noodles, and beef noodles. Each type is accompanied by a small illustration, place of origin, key ingredients, and eating tips. Beige base with warm brown, the overall look is like a designer print.

Landmark Technical Annotation Information Tour

Landmark Technical Annotation Information Tour

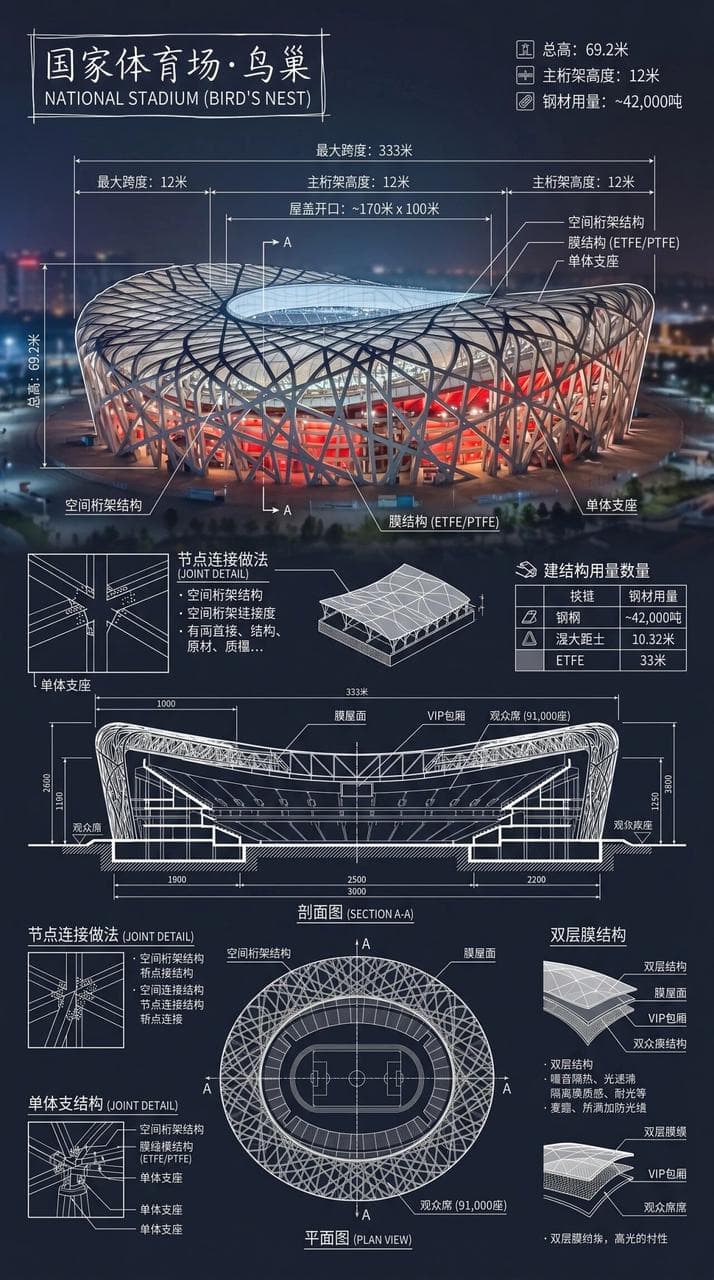
Create an infographic of the National Stadium·Bird's Nest. Combine real photos of landmarks with white technical note overlays and write the building name in a hand-drawn box in the corner. The picture is superimposed with complex and clear white technical annotations, showing key structural data, important measurements, material quantities, detailing methods, and including sections, plans, and significant architectural and engineering features, and integrated into a complete overview long picture. The white lines are detailed and clear, the real environment is visible, the vertical composition is professional, rational and readable.

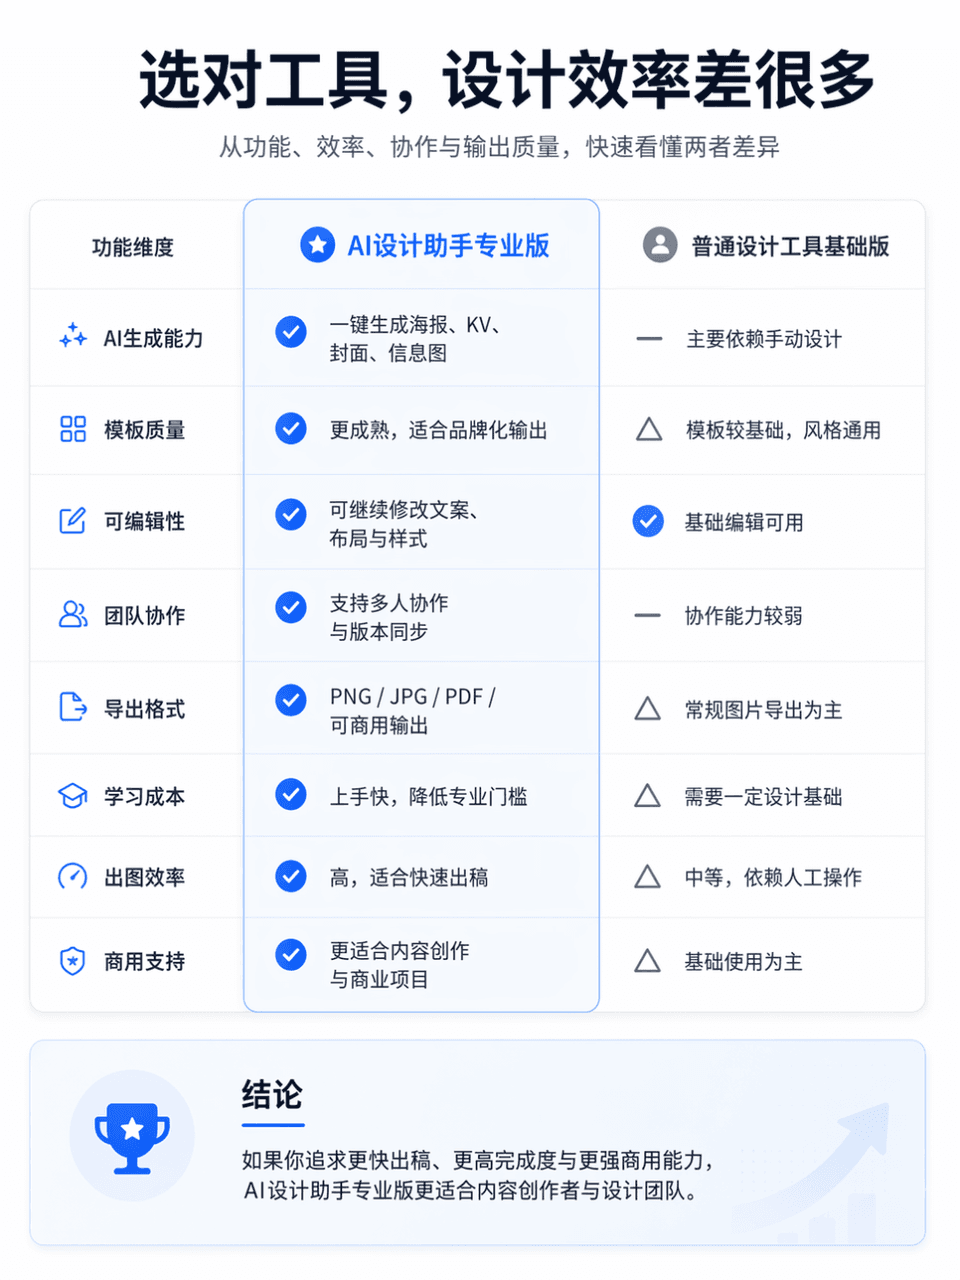
Product comparison chart

Product comparison chart

The frame size is 3:4, and a professional and clear product function comparison chart is generated. The comparison object is AI Design Assistant Professional Edition vs. General Design Tool Basic Edition. The overall layout is divided into left and right columns for comparison. The left side is "AI Design Assistant Professional Edition" and the right side is "General Design Tool Basic Edition". Place an eye-catching main title at the top of the screen, "Choose the right tool, and the design efficiency will be much different." The subtitle can be supplemented with "Quickly understand the differences between the two in terms of functionality, efficiency, collaboration, and output quality." The overall style refers to the product comparison page of the official website, which requires a simple layout, clear information hierarchy, sufficient white space, modern fonts, restrained and advanced color matching, and the visual texture of a real Internet product official website. You can add slight icons, dividers, card shadows and key highlights, but avoid e-commerce promotions, clutter, and low-quality tables.

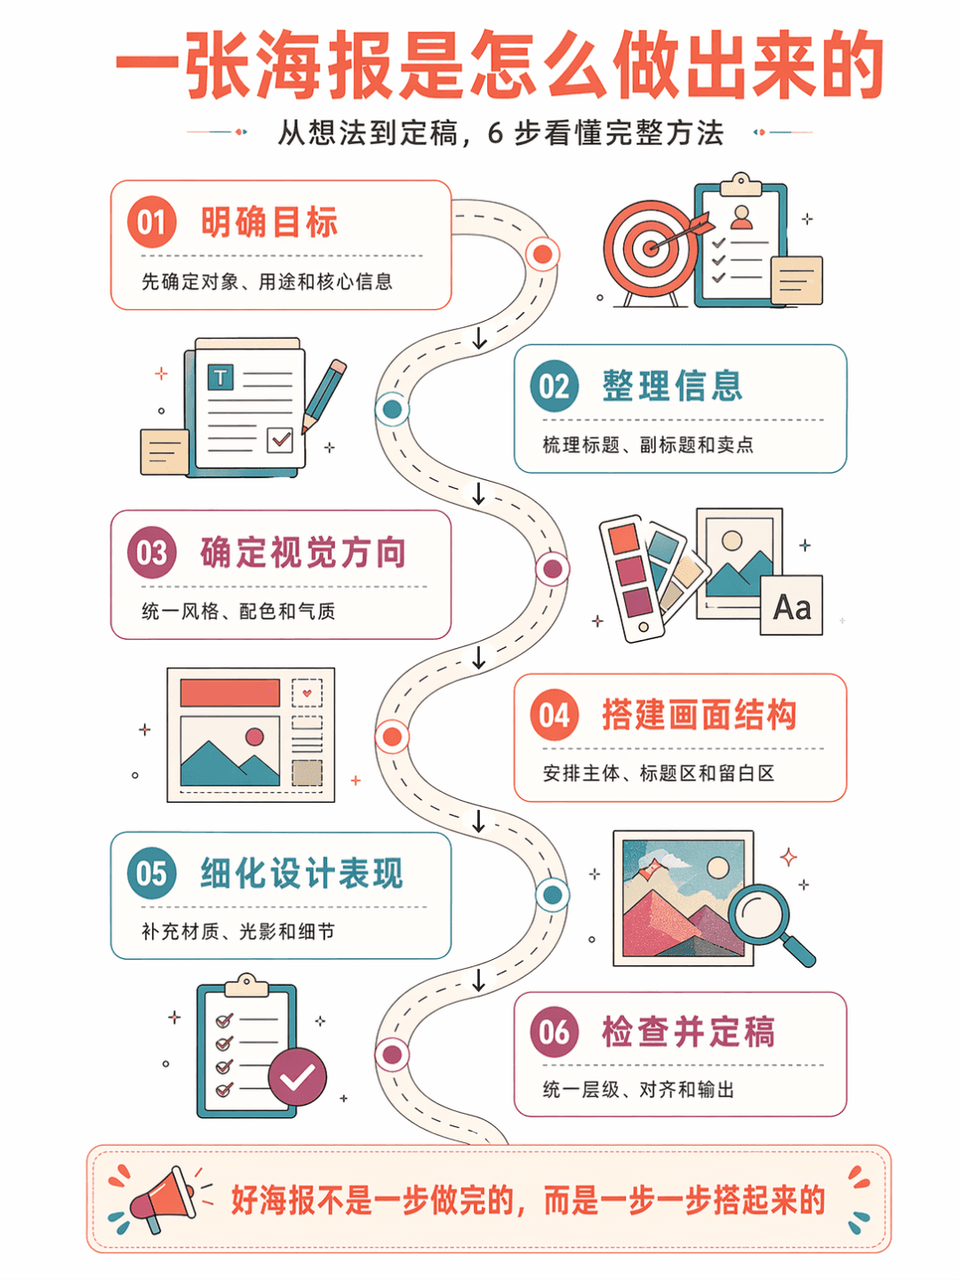
Method flow chart

Method flow chart

Generate vertical method flow chart poster "AI Poster Production Flow Chart", summarizing 6 steps. The style is: large white space on a white background, series of steps on a curved road, isometric information illustration, retro flat geometric style, coral orange + lake blue + purple red color scheme, thin line strokes, refreshing and orderly. Each step includes a number, title, short description, and arrow connections. The Chinese language is accurate, has a strong tutorial feel, and is suitable for course illustrations.

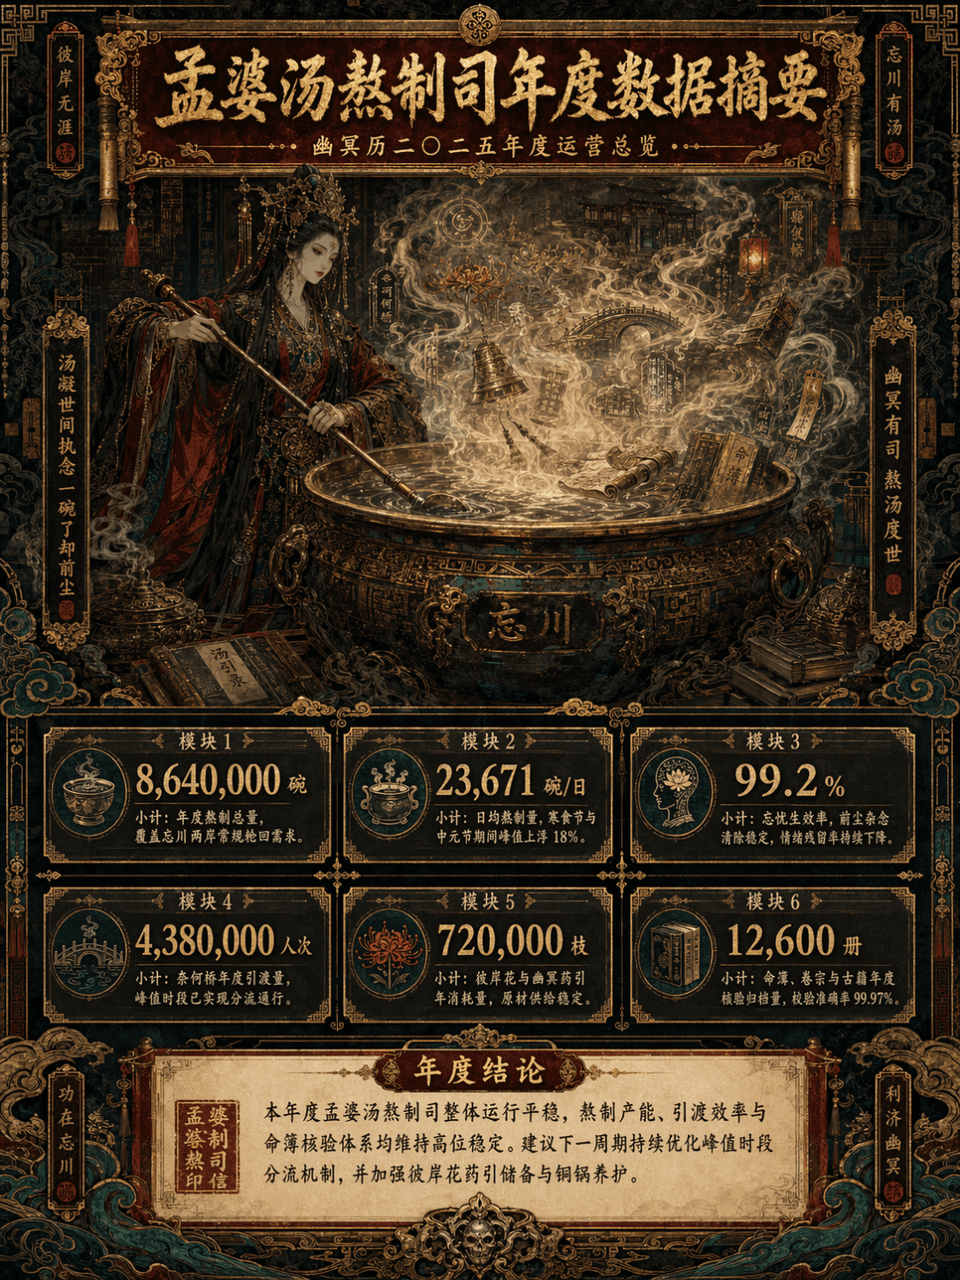
Data summary long chart

Data summary long chart

Picture frame 3:4, create a long vertical data summary picture with the theme of "Annual Data Summary of Meng Po Soup Making Department". The main subject is Meng Po cooking soup in front of a huge copper pot. The steam is surging. In the mist of the soup, there are faintly visible Bana flowers, Naihe Bridge, lanterns, runes, scrolls, copper bells, ancient books, fortune books, clouds and ghost patterns. The overall design adopts a maximalist style, but the information level must be clear, such as the combination of consulting report visualization + Oriental Monster setting set + advanced exhibition long picture. The picture is a long vertical version of the infographic, with the title area at the top, the main visual area in the middle, the data module area at the bottom, and the conclusion area at the bottom unfolded layer by layer. The color scheme is controlled to the four main colors of dark vermilion, gilt, jet black, and peacock green, with partial embellishments of old paper off-white and patina green. The picture is gorgeous, complex, mysterious, and solemn, but it cannot be chaotic and out of control. It must be high-end, orderly, and have strong decorative aesthetics.

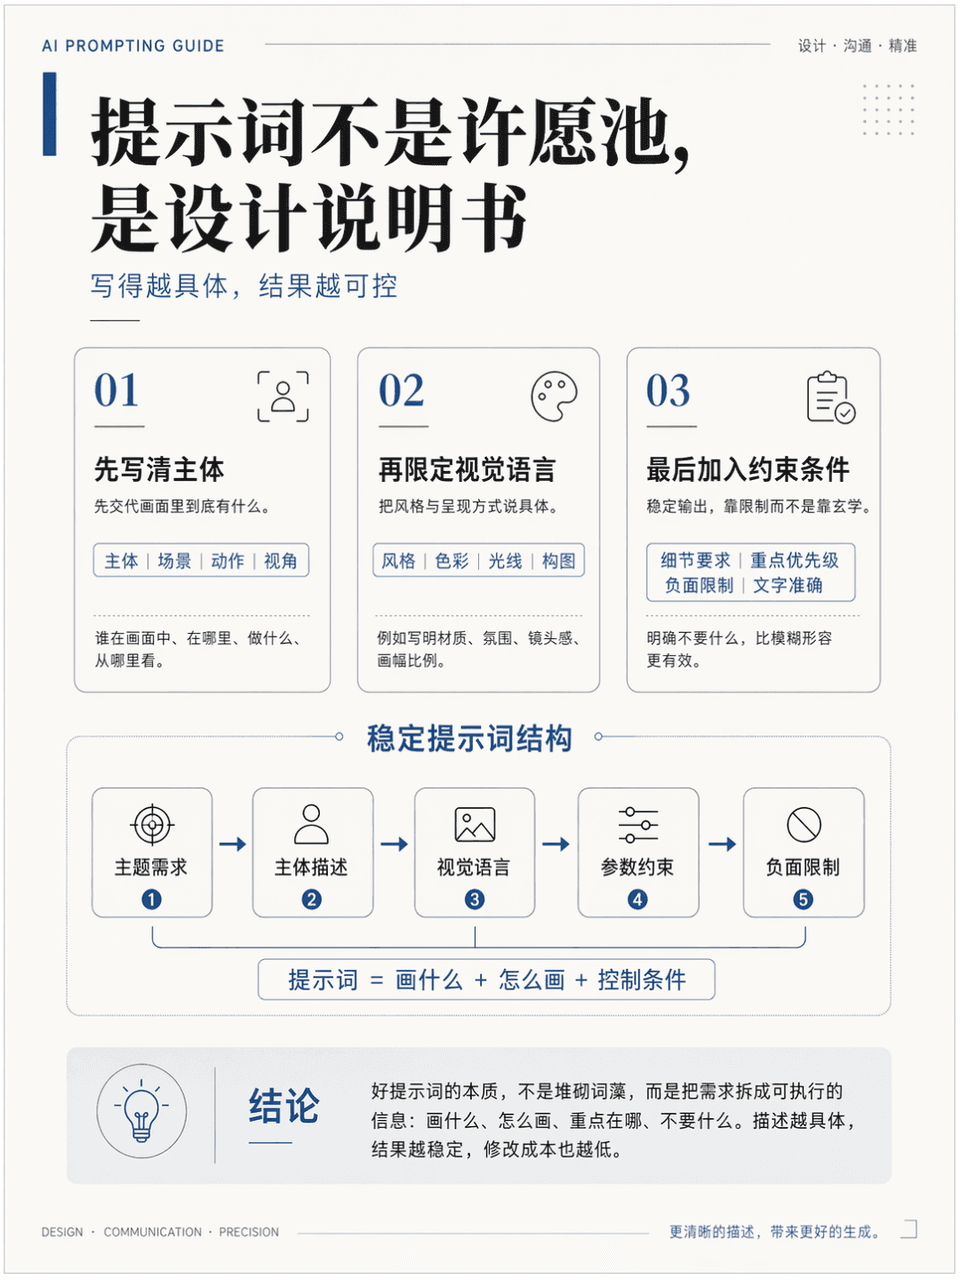
Teaching Illustrated Posters

Teaching Illustrated Posters

The frame size is 3:4, and a vertical teaching illustration poster is generated to explain the knowledge point "How to write more stable AI drawing prompts". It needs to include a title, 3 key modules, 1 core diagram, and 1 conclusion area. The title is "The prompt is not a wishing well, it is a design instruction". It looks like a high-quality course handout page. It is professional, clean, and academic. It also has a sense of advanced design. The Chinese language is accurate, the hierarchy is clear, the layout is restrained, and there is sufficient white space.

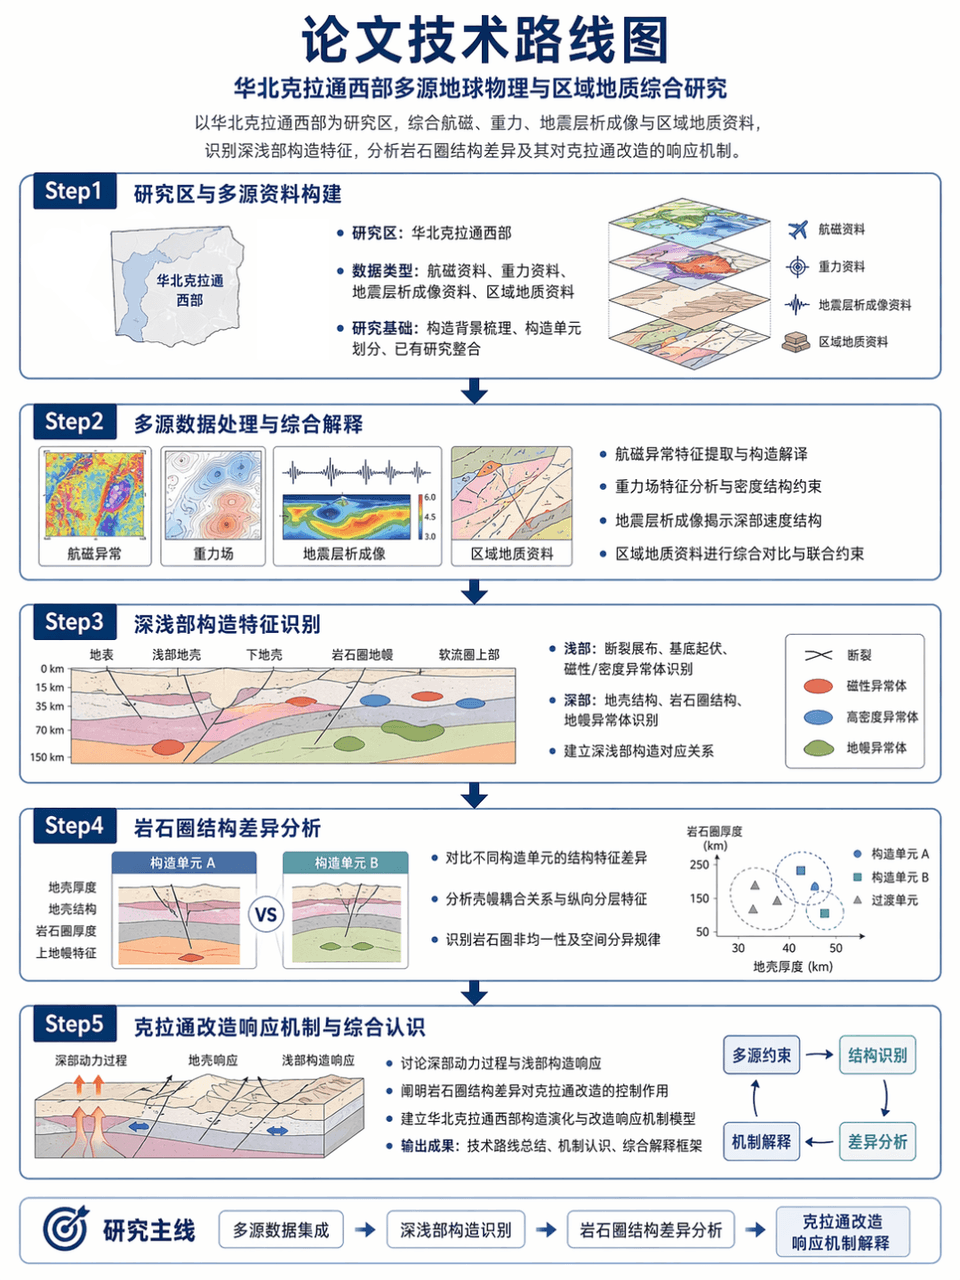
Thesis technology roadmap

Thesis technology roadmap

Picture frame 3:4, generate the technical roadmap of the thesis: taking the western part of the North China Craton as the research area, integrating aeromagnetic, gravity, seismic tomography and regional geological data, identifying the deep and shallow structural characteristics, and analyzing the differences in lithospheric structure and its response mechanism to the craton transformation. Use a Step1-Step2-Step3-Step4-Step5 structure, with clear arrows, accurate terminology, and restrained and professional layout.

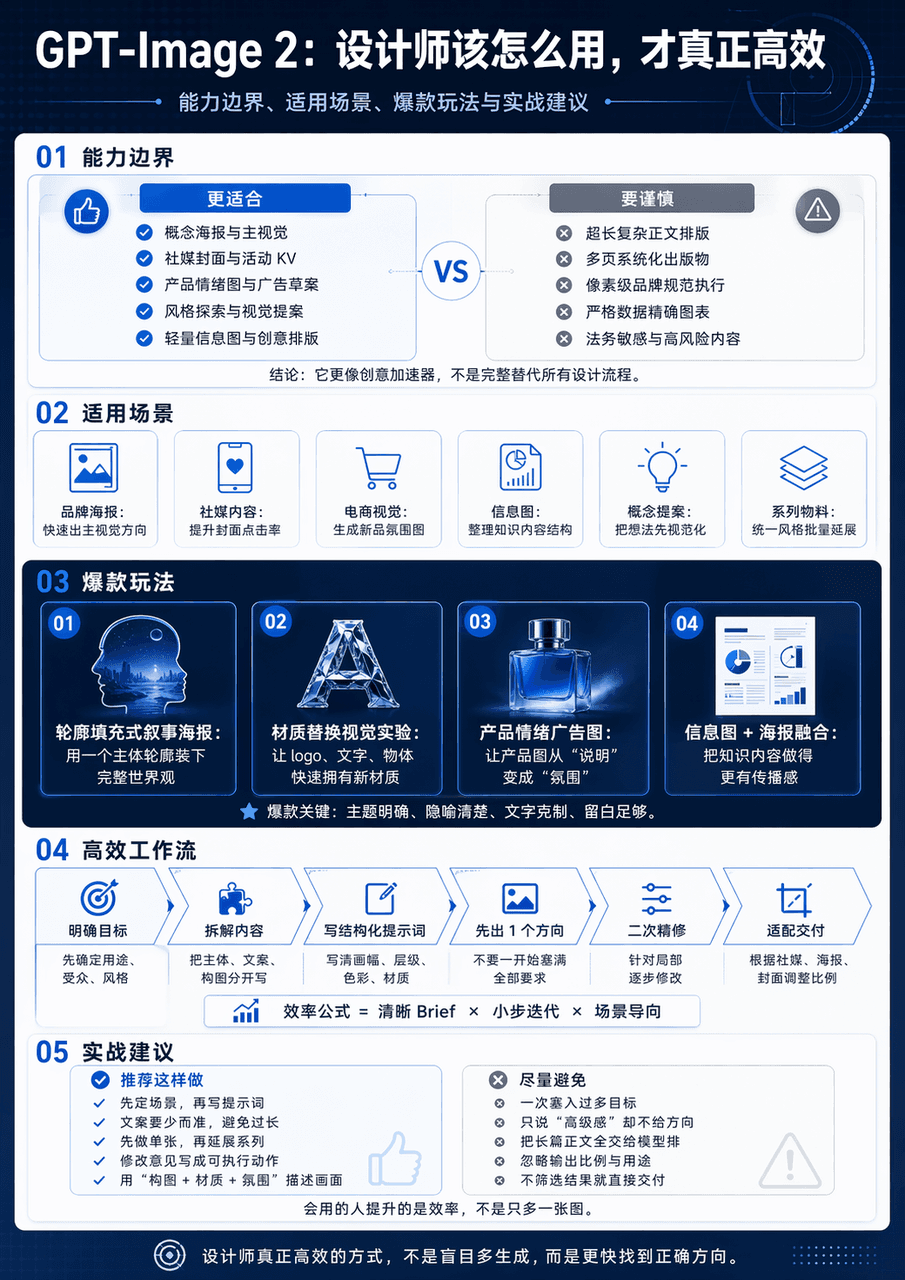
Technology infographic

Technology infographic

Generate a vertical science and technology information map with the theme of GPT-Image 2 Design Application Guide. The whole map is divided into 5 modules. The big title "GPT-Image 2: How should designers use it to be truly efficient" is set at the top. The subtitles are capability boundaries, applicable scenarios, popular gameplay and practical suggestions. The middle diagram adopts the form of minimalist interface card + process arrow + comparison structure chart. The information level is clear and the visual center is clear.

Potted Plant Mood Diary

Potted Plant Mood Diary

"Weekly Diary of the Emotions of Potted Plants" is a combination of a handbook style diary and plant observation illustrations. The 7-day vertical page records the light, water volume, leaf status, number of new shoots, owner's mood, weather and a small confession. The protagonist is a pot of green plants by the window. The style is quiet and healing, with a ratio of 9:16.

Late-Night Subway Guide Poster

Late-Night Subway Guide Poster

"A comforting guide for passengers on the last subway train" combines public service visuals with humane copywriting. The image looks like a public welfare poster at a subway station. The content includes the last train time, night transfers, taxi spots, emergency telephone numbers, hot drink vending machines, and suggestions for home routes. It also adds gentle copywriting "Thank you for your hard work, please go home safely today", with a ratio of 4:5.

"Illustrated Tools for Street Shoe Repair Shops"

"Illustrated Tools for Street Shoe Repair Shops"

"Illustrated Tools of a Street Shoe Repair Shop" combines craft anthropology with still life photography. The main picture is an overhead shot of an old craftsman's workbench. Shoe lasts, pliers, needlework, glue, polishing cloth, shoe sole samples, and account books are presented like specimens. Each tool is accompanied by a small handwritten note describing its traces of use and age. The ratio is 4:5.

Fantasy Botanical Field Journal

Fantasy Botanical Field Journal

"Magic Plant Greenhouse Observation Log: Glowing Ferns" is a fusion of scientific research archives and fantasy plant illustrations. The left side shows the different growth stages of plants and the comparison of day and night luminous intensity. The right side shows greenhouse environmental parameters, leaf macro, root system profiles and care suggestions. The whole thing looks like a serious botany poster, but the object comes from a fantasy world, with a ratio of 4:5.

"Urban Tree ID Card System"

"Urban Tree ID Card System"

"Urban Tree ID Card System" is a visual fusion of public ecological design and archives. The picture shows the trees on both sides of the street. A minimalist information sign is erected in front of each tree to record the age of the tree, tree species, flowering time, shade index, bird preference, and suitable walking period. On the right side are the design specifications and QR code interface of the sign, with a ratio of 16:9.

“Genealogy of the Chinese Dim Sum Universe”

“Genealogy of the Chinese Dim Sum Universe”

"Chinese Dessert Universe Genealogy" is a combination of museum-style information graphics and high-end food photography. In the center is a star chart-like structure. Moon cakes, mung bean cakes, Dingsheng cakes, peach cakes, donkey rolls, horseshoe cakes, etc. are arranged like constellation nodes. The connecting lines mark the relationship between region, festival, taste and craftsmanship. There is a close-up of the food next to each node. The title is solemn and grand, with a ratio of 4:5.

Rainy Season Weather Diary

Rainy Season Weather Diary

"Designing a visual weather diary for the rainy season", the handbook page is integrated with the weather chart. The vertical screen is composed of weather entries for 14 consecutive days. Each day includes cloud cover, rainfall, clothing dryness index, mood icons, today's suitable food, and window observation vignettes. The layout is exquisite, like a very healing independent publication, with a ratio of 9:16.