New: GPT Image 2.5 Flare and Sunburst. Try them free with 3 images on sign-up, then 8 credits each.
Try GPT Image 2.5

GPT Image 2 Prompts

8,665 templates · updated Oct 2026

GPT Image 2 is OpenAI's image generation and editing model (gpt-image-2). It follows long, structured instructions closely, which makes it a strong fit for posters, product shots, UI mockups and infographics with short on-image text.

This page lists the 8,665 library templates set up for GPT Image 2. Each one opens in the generator with GPT Image 2 selected: 43 credits at 1K, up to 16 reference images and 16 aspect ratios. GPT Image 2 Saver runs the same model for a flat 5 credits at any size.

Showing 901–960 of 989 GPT Image 2 · Infographic / Education prompts

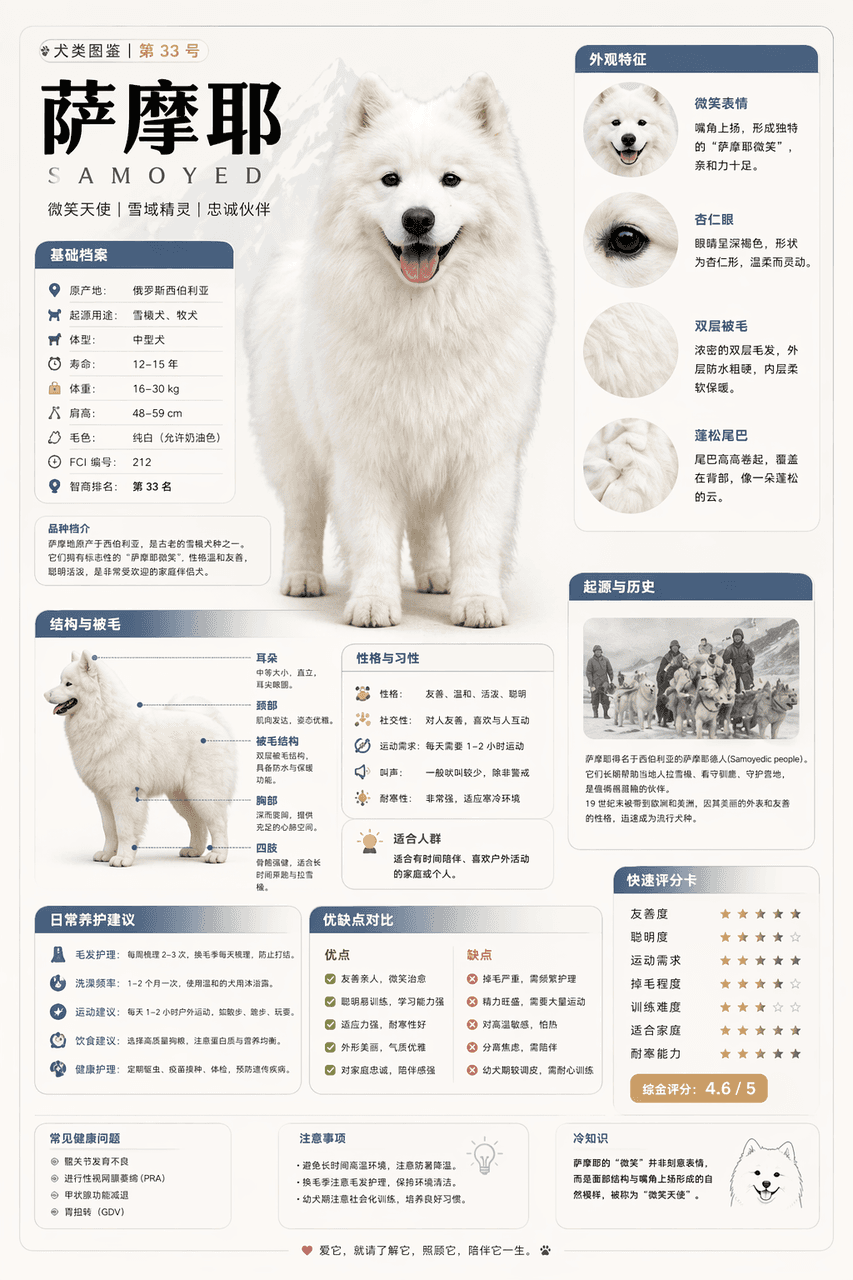
Modular Encyclopedia Infographic

Modular Encyclopedia Infographic

Please generate a high-quality vertical "popular science encyclopedia map" based on [Samoyed]. This picture is not an ordinary poster, nor is it a simple illustration, but a modular science information map that has a "picture book feel, an encyclopedia feel, a sense of information structure, and a sense of collection". The overall style refers to the combination of advanced natural history illustrations, modern encyclopedia pages, lifestyle knowledge cards and social media high-dissemination information graphics. Please make the screen contain: A clear and beautiful theme main vision Several local features enlarge details Multiple rounded corner modular information partitions Clear title hierarchy and key labels Concise but rich encyclopedia content Visual scoring, summary of key points or Top 5 modules The content columns should be automatically adapted according to the theme, giving priority to choosing from these directions and combining them appropriately: Basic files, classification information, appearance characteristics, habits/ecology, formation mechanism/structural composition, growth or use conditions, care or maintenance suggestions, risks and precautions, suitable people or applicable scenarios, comparison of advantages and disadvantages, and quick score card. Visual requirements: Light and clean background, soft colors, light shadows, exquisite small icons, rounded information boxes, neat layout, high information density but not crowded, good reading experience. The whole thing must look like a popular science encyclopedia card that can be truly published, read, collected, and serially produced, rather than an advertising image. Please do not make it into an ordinary commercial poster. It is necessary to highlight the characteristics of "knowledge organization + module information + illustrated display". (Refer to X knowledge diagram)
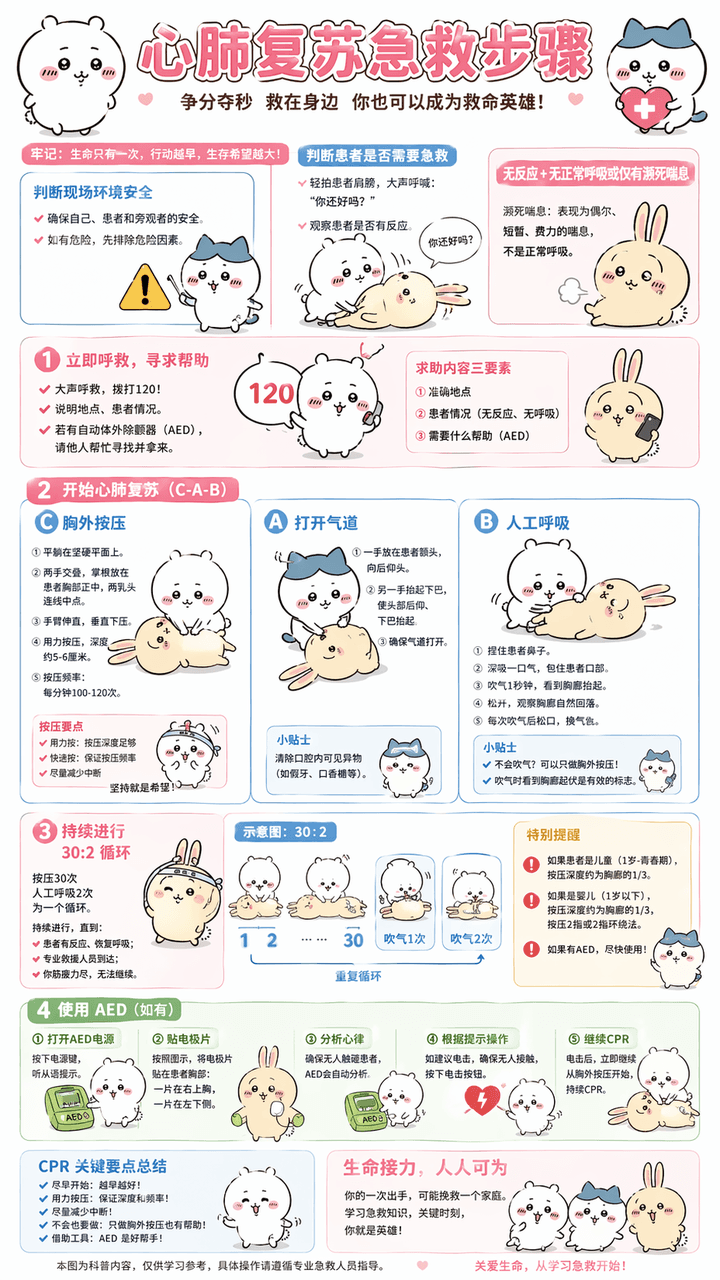
Cardiopulmonary Resuscitation Explanation Chart

Cardiopulmonary Resuscitation Explanation Chart

Generate "cardiopulmonary resuscitation first aid steps" explanation diagram, replace technical vocabulary with popular vocabulary, Chinese dialogue, use Chiikawa as the overall image guide, pure Chinese, information must be sufficiently detailed and accurate, ratio 9:16, 4k Compared to nano banana pro, I think the character image is a bit blurry, as are the small fonts.

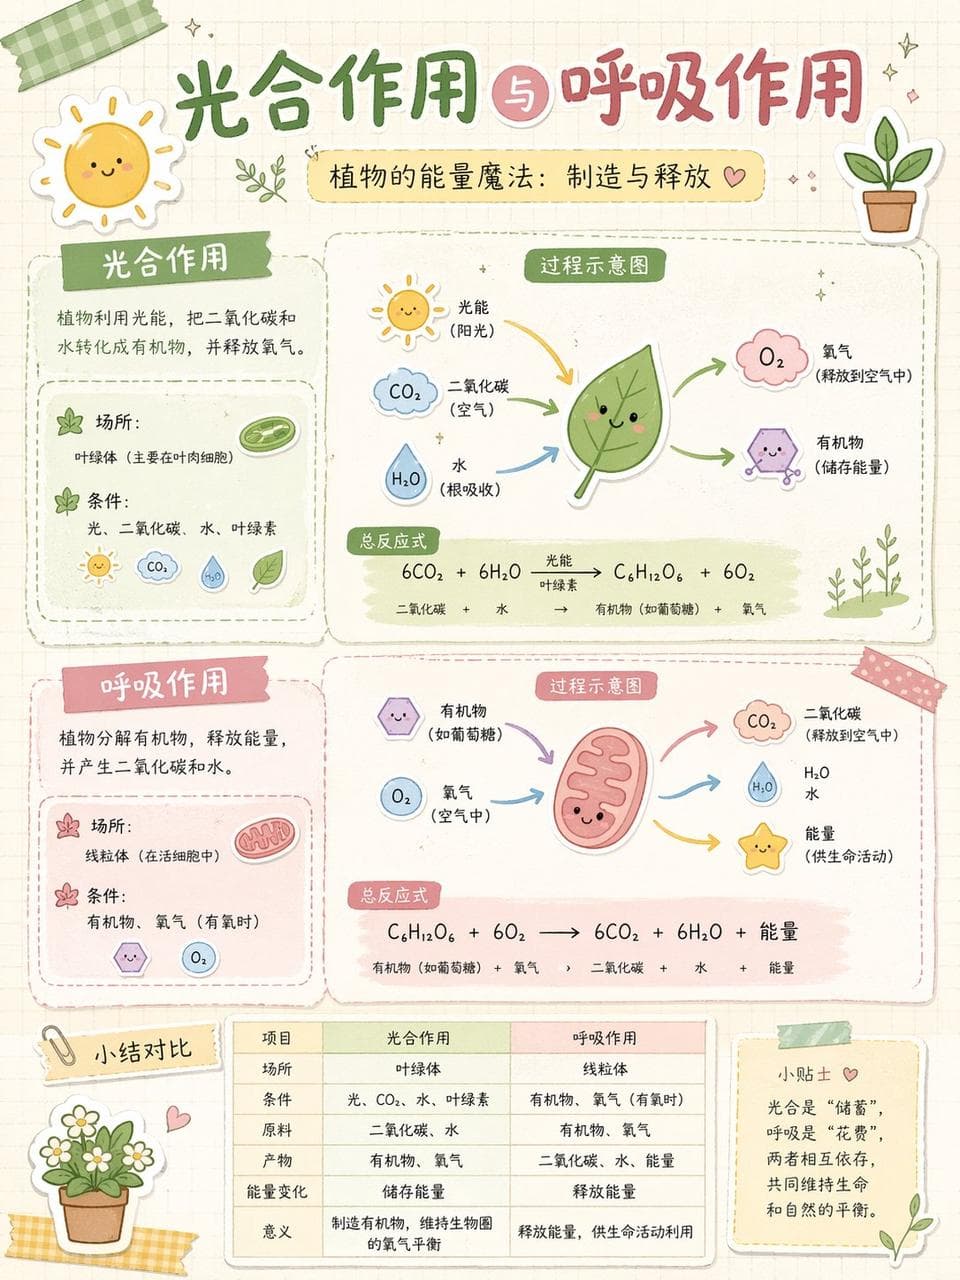
Handbook collage

Handbook collage

You are good at deconstructing complex knowledge and using the art of "Scrapbook Collage" to transform it into visual information graphics that are both educational and healing.

Illustrated Workout Infographic Chart

Illustrated Workout Infographic Chart

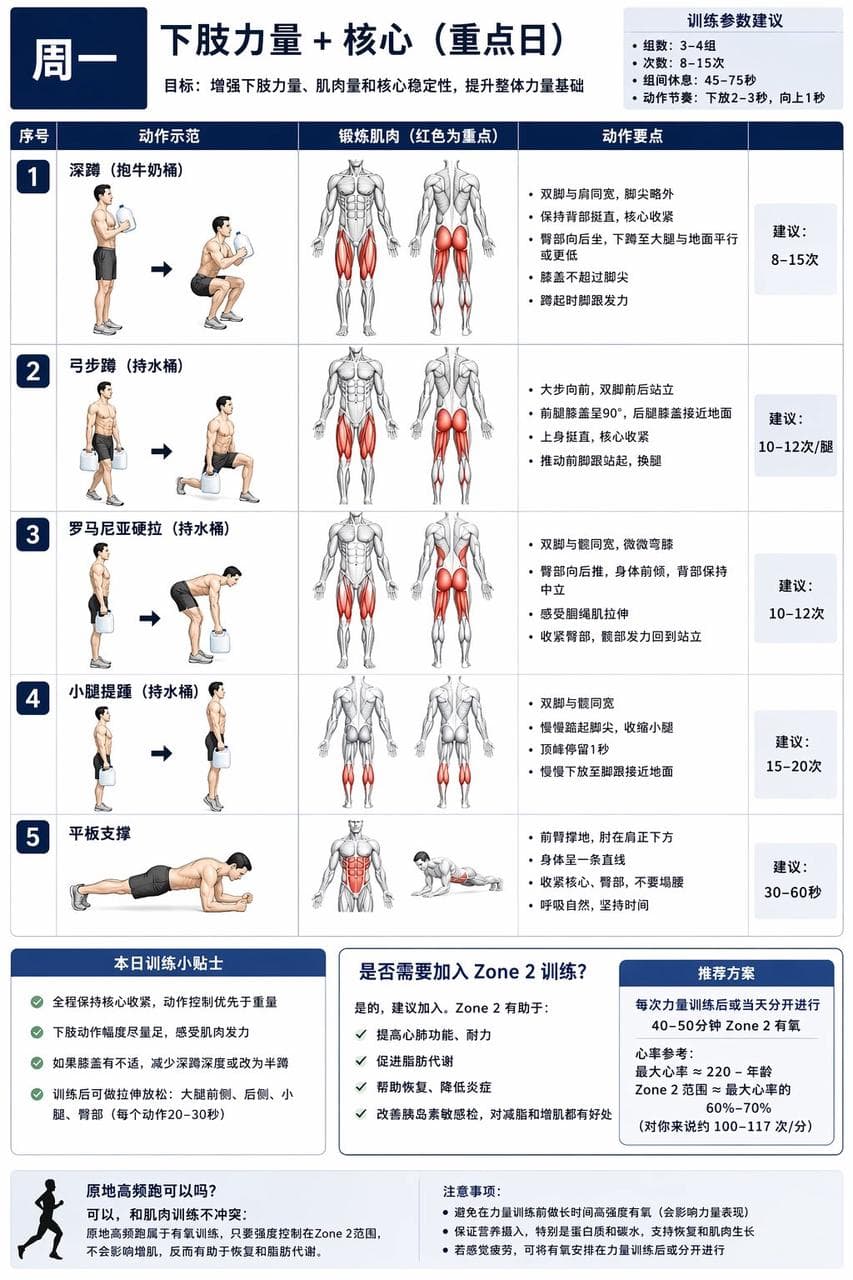
For XX-year-old me, I have developed instructions and diagrams for a comprehensive muscle-building training plan that can be completed at home with no equipment or with a small amount of equipment. I (the following are my special requirements. You can modify them yourself) currently use 1-gallon milk bucket water instead of dumbbells. The water can be filled or not filled to meet the different requirements of beginners. I also have a set of fitness elastic bands. The training cycle is a weekly cycle, and different parts need to be trained every day. There must be rest days or staggered training to avoid excessive fatigue of muscles in a certain area and affecting the training effect. It requires a focus on core and lower body strength, abdominal muscles, chest muscles, as well as shoulders and upper arms. First generate a general chart, and then generate separate daily training plan charts according to my instructions. Instead of using realistic photos for the characters in the picture, use illustrations of muscular men commonly seen in fitness charts. In the illustrations, the muscles being exercised are represented in red.

Building disassembly diagram

Building disassembly diagram

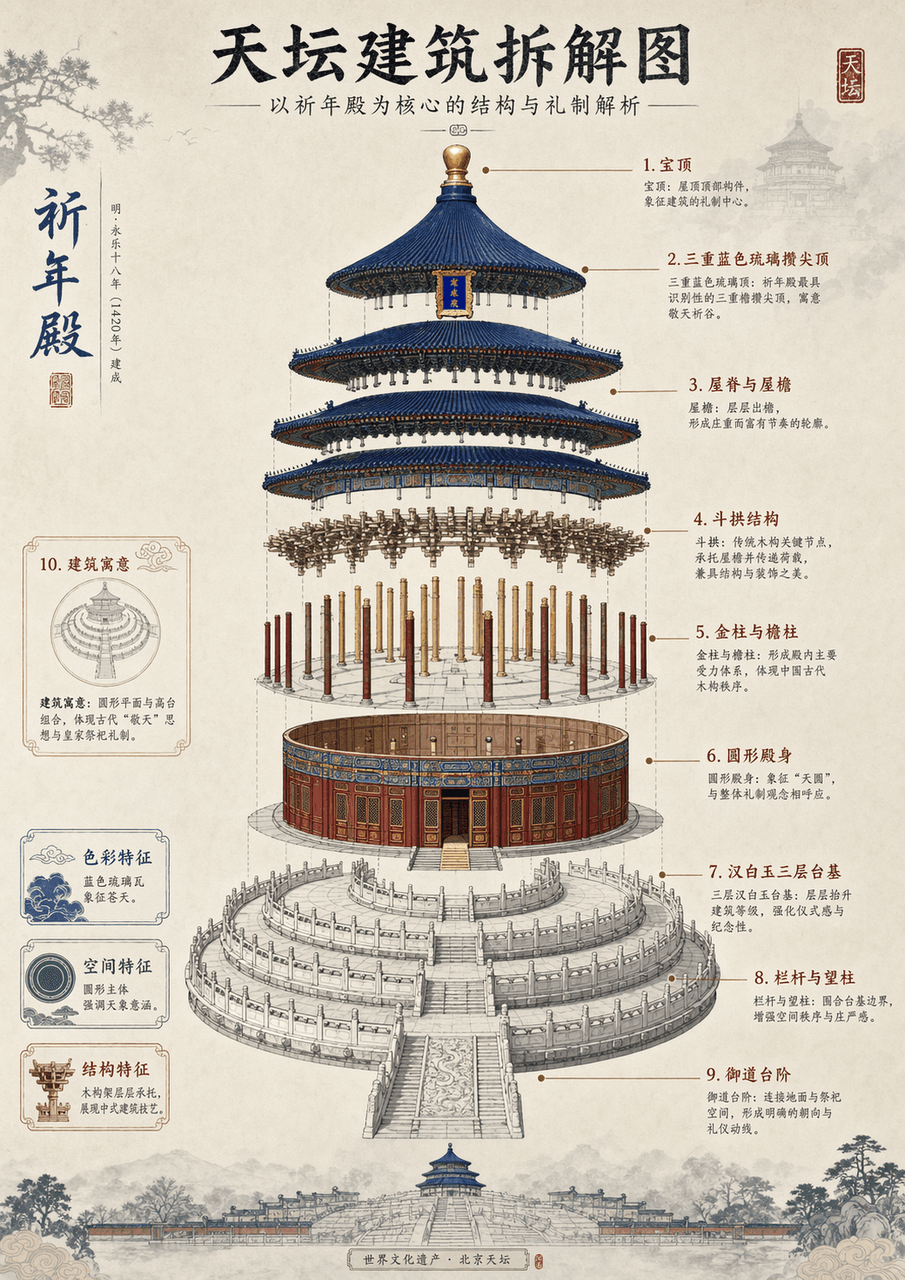
Generate an architectural disassembly diagram of (Temple of Heaven, **Eiffel Tower**) with detailed instructions and Chinese aesthetic style

Prompt 06

Prompt 06

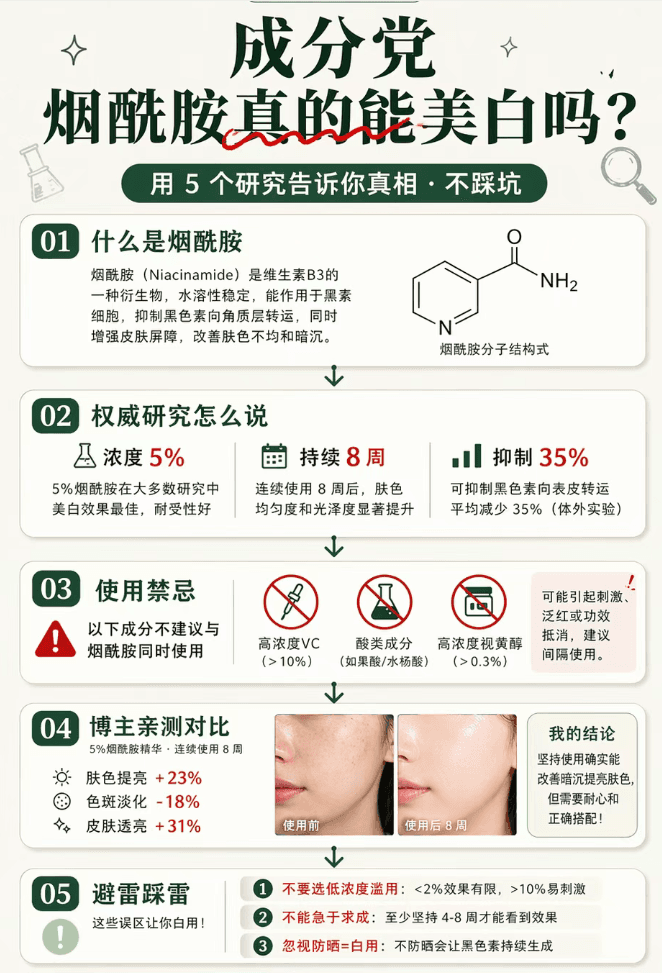
A long picture of popular science about skin care ingredients in the style of Little Red Book, with a vertical format of 9:16 (suitable for long picture note covers). The overall sense of rigorous science popularization: off-white background + dark green main color + red for data emphasis. The big title at the top is "Ingredients/Can Niacinamide Really Whiten?" (serif bold dark green + "Really" is crossed by a red wavy line to imply the inversion) + subtitle "Use 5 studies to tell you the truth · Don't step on the trap." The main body below is an arrangement of popular science cards: ① "What is nicotinamide" card (white background with rounded corners + an explanation of about 50 words + a schematic diagram of the structure of a small molecule next to it); ② "What does authoritative research say" card (3 key points of research data: concentration 5%/8 weeks/inhibition 35%); ③ "Usage Contraindications" card (red warning mark + 3 ingredients that cannot be combined); ④ "Blogger Personal Test Comparison" card (before and after skin photos + brief conclusion); ⑤ "Lightning Protection and Lightning Protection" card (marked with 3 points including "Do not choose low concentration abuse"). There are connecting symbols (downward arrows/dividers) between each card. The "Follow to Unlock More" card at the bottom + blogger information + "Full Ingredient List → Click on the homepage" guide. The overall popular science feel is compatible with the aesthetic of Xiaohongshu. The information density is extremely high but the structure is clear. The picture ratio is 9:16.

Prompt 01

Prompt 01

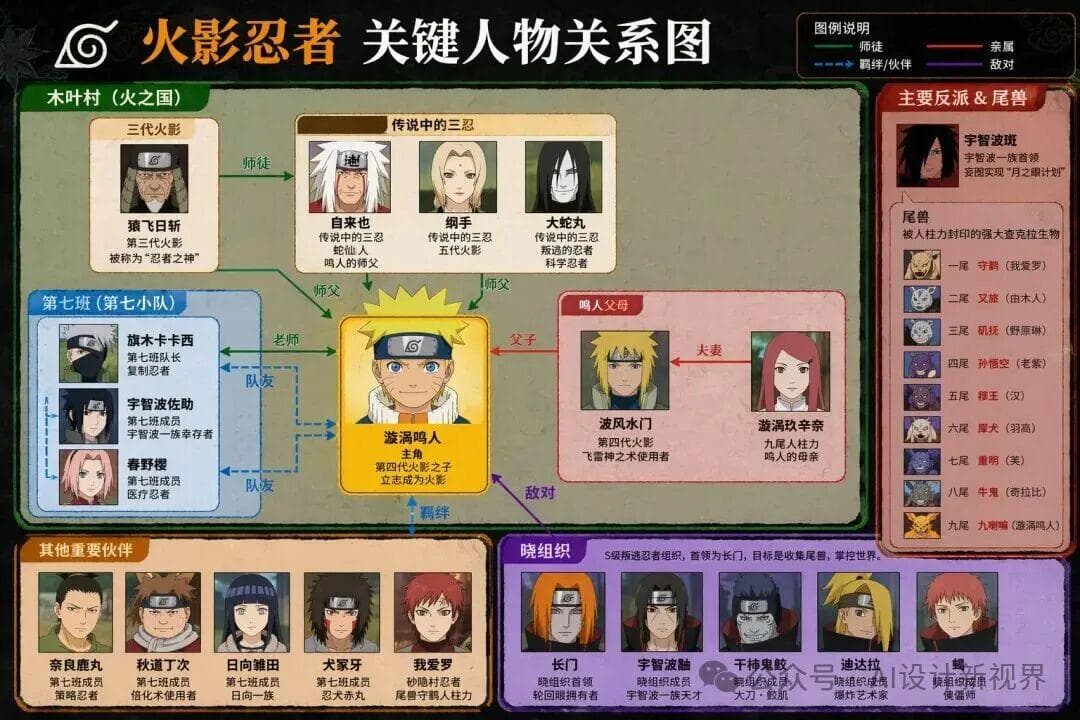
Please generate the key person relationship diagram of "XXX"

Daydreaming #47

Daydreaming #47

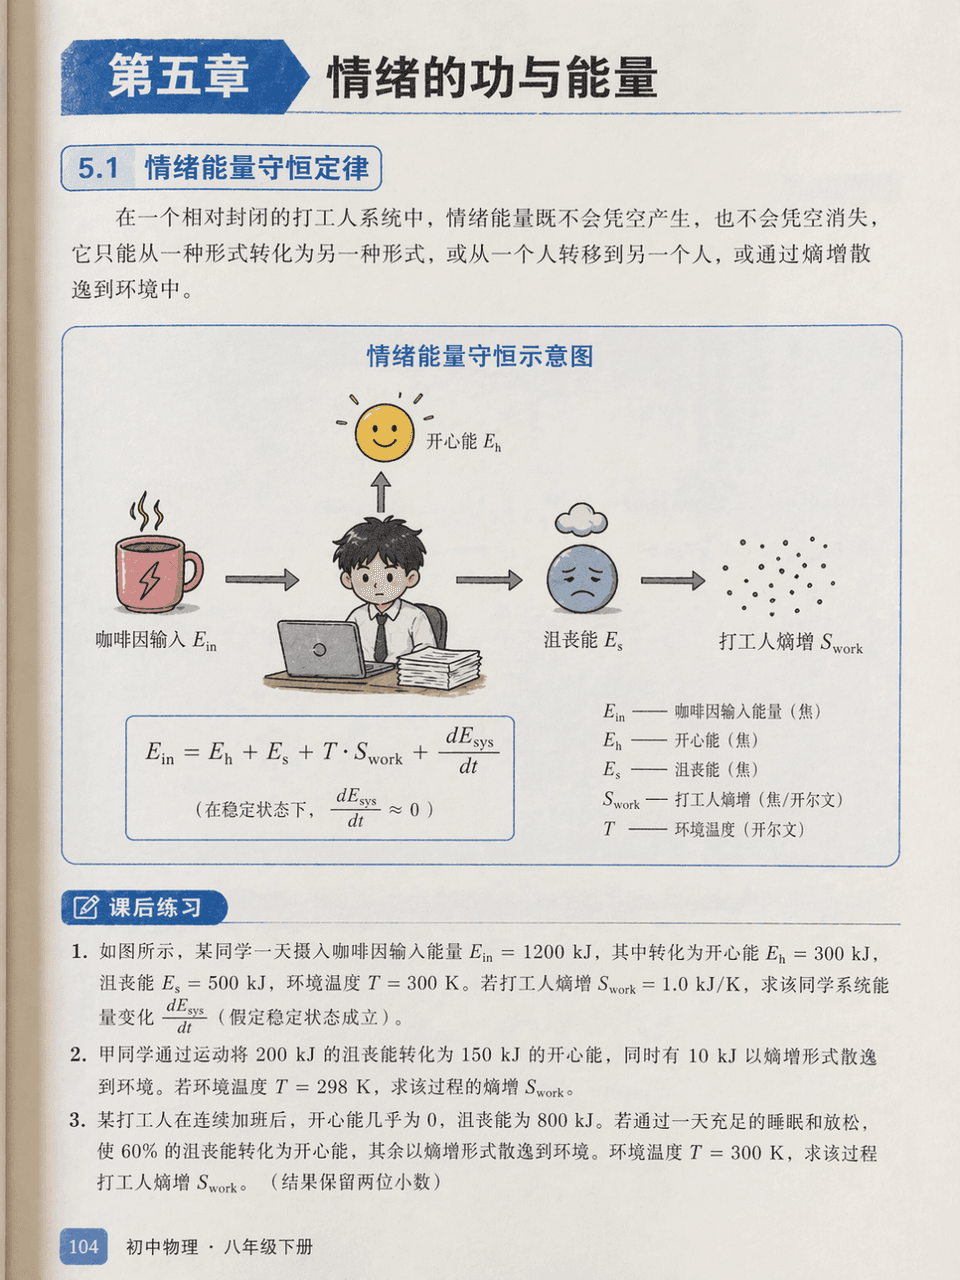
Prompt words: Draw an illustration page from a junior high school physics textbook, chapter "Chapter 5: Work and Energy of Emotions". There is a serious energy conservation diagram but the labels are "happy energy", "frustration energy", "caffeine input" and "worker entropy increase". The three after-class exercises below are serious.

Cute Picture Book #29

Cute Picture Book #29

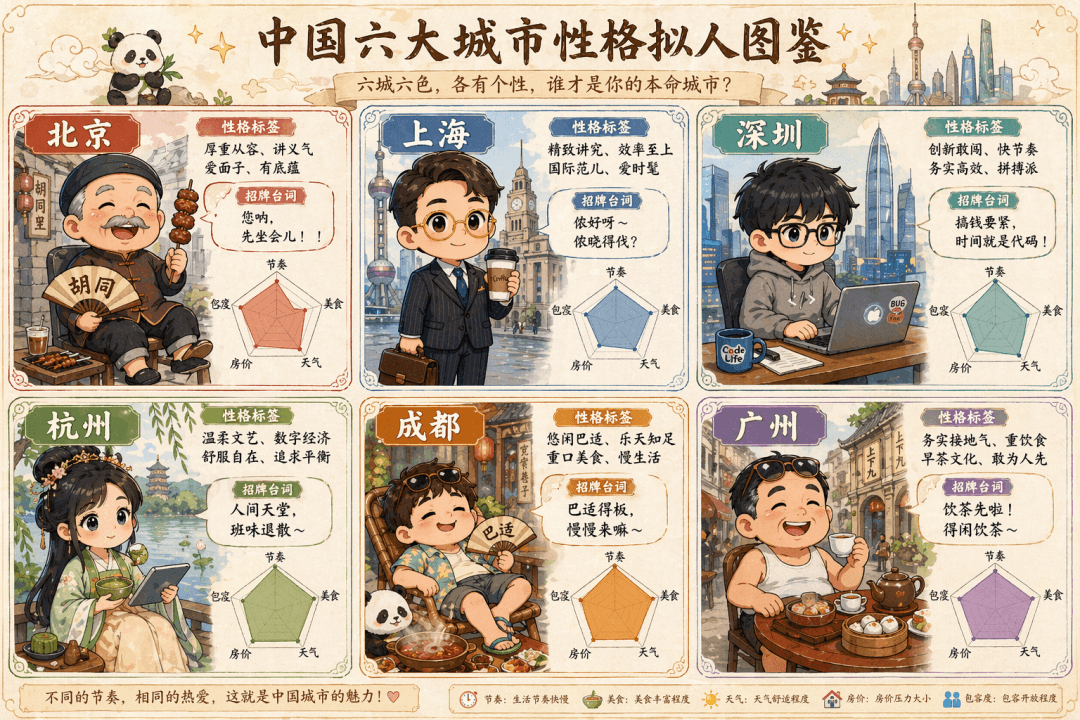
The prompt is to draw a cute hand-painted "Anthropomorphic Illustration of Characters in Six Big Cities in China". The six Q-version villains in the six-square grid represent Beijing (the old man in the alley wearing a Tang suit wearing strings), Shanghai (the elite white-collar worker with gold-rimmed glasses holding a coffee), Shenzhen (the programmer in a sweatshirt holding a notebook), Hangzhou (the girl in Hanfu holding matcha and a tablet), Chengdu (half-lying in shorts and flip-flops around a hot pot), and Guangzhou (Lao Guang drinking morning tea in flip-flops). Each grid is equipped with a personality label, signature lines, and a radar chart (five dimensions: rhythm, food, weather, housing prices, and tolerance), and the whole is like an elf guide.

Cute Picture Book #28

Cute Picture Book #28

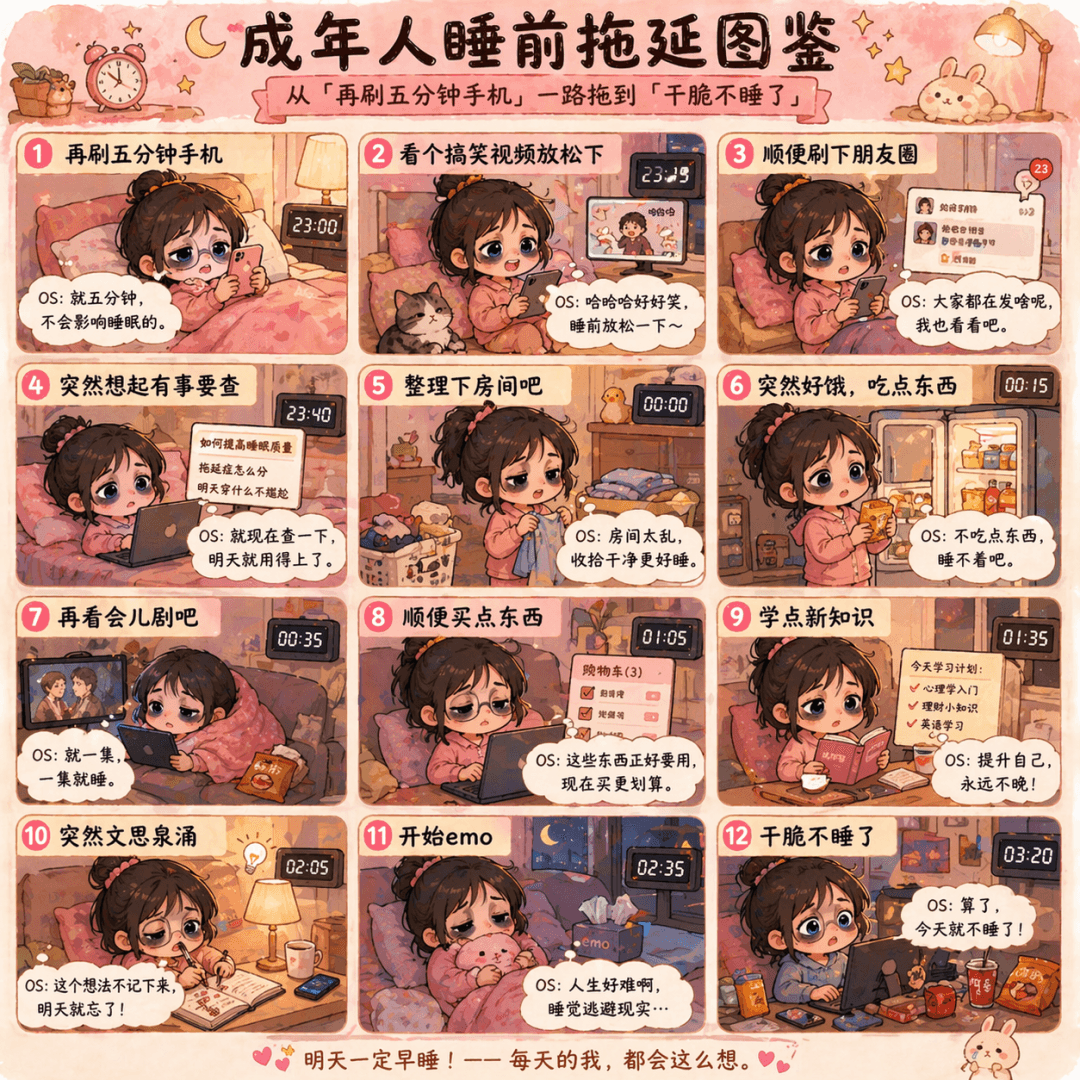
The prompt is to draw a Q-version cartoon of "Bedtime Procrastination Illustrated Guide for Adults", with the zodiac grid dragging from "check the phone for another five minutes" to "don't sleep at all". Each frame has a small black-eyed doll and a heartfelt OS message, in pink and warm yellow colors.

Cute Illustrated Book #27

Cute Illustrated Book #27

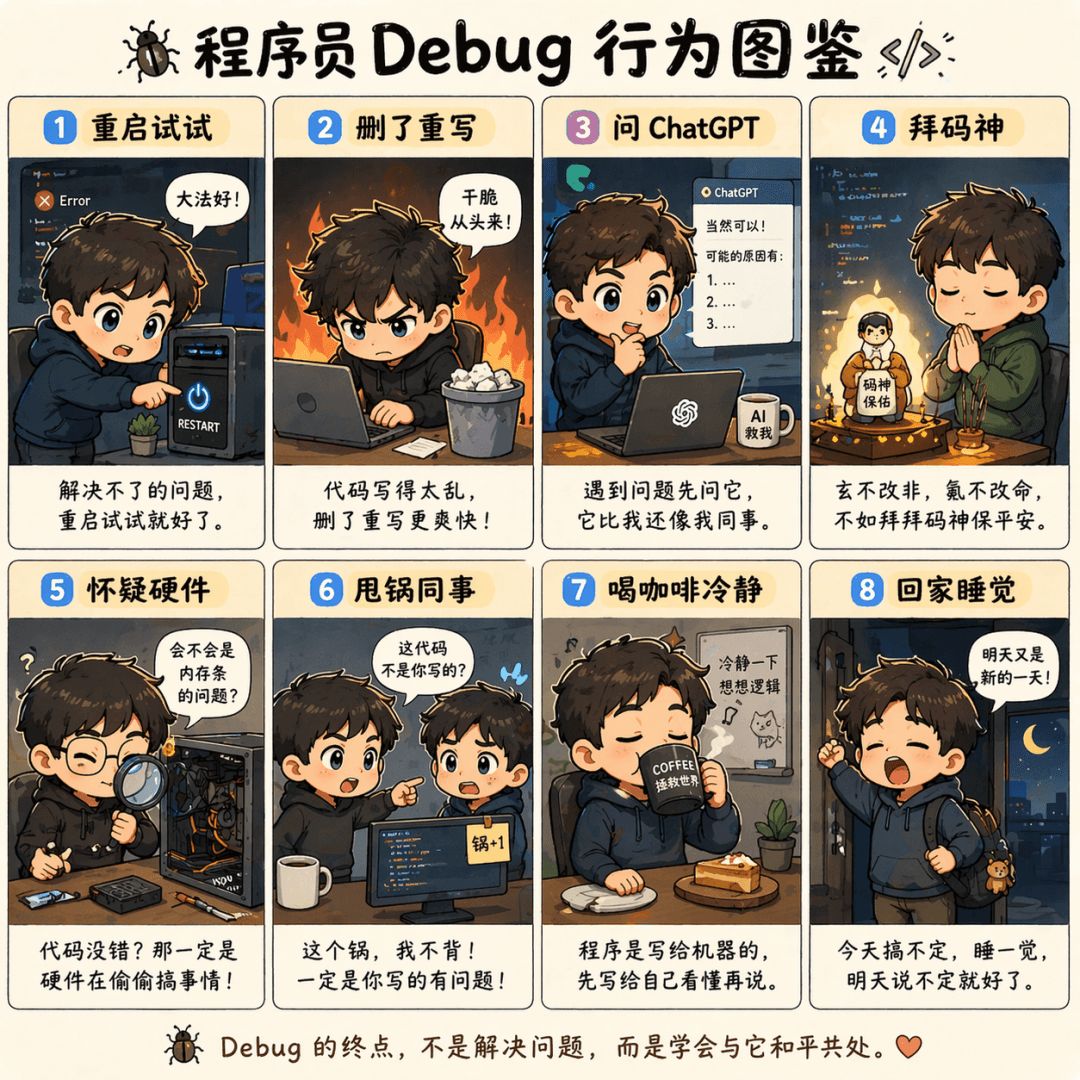
The prompt is to draw an eight-square Q version illustration of "Programmer Debug Behavior Illustration". A situation in each cell includes "Restart and try", "Delete and rewrite", "Ask ChatGPT", "Worship the code god", "Doubt the hardware", "Dump the colleague", "Drink coffee to calm down" and "Go home and sleep". Each cell is equipped with a line of complaining text.

Cute Picture Book #26

Cute Picture Book #26

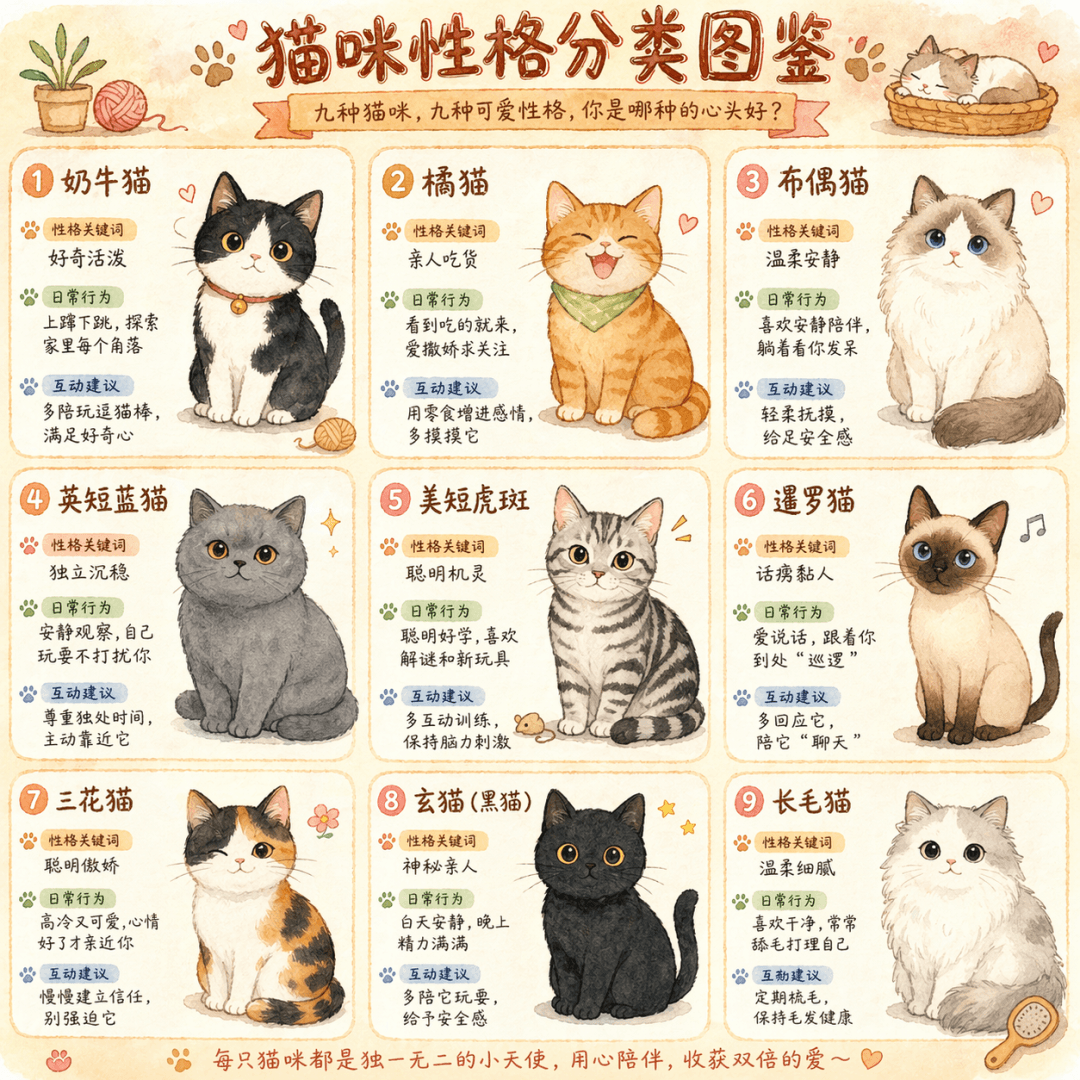
The prompt is to draw a cute hand-drawn infographic called "Cat Personality Classification Illustration", with nine different colors of cats in a nine-square grid. Each box is equipped with a personality keyword, daily behavior description, and interactive suggestions, in a warm watercolor style.

Cute Picture Book #25

Cute Picture Book #25

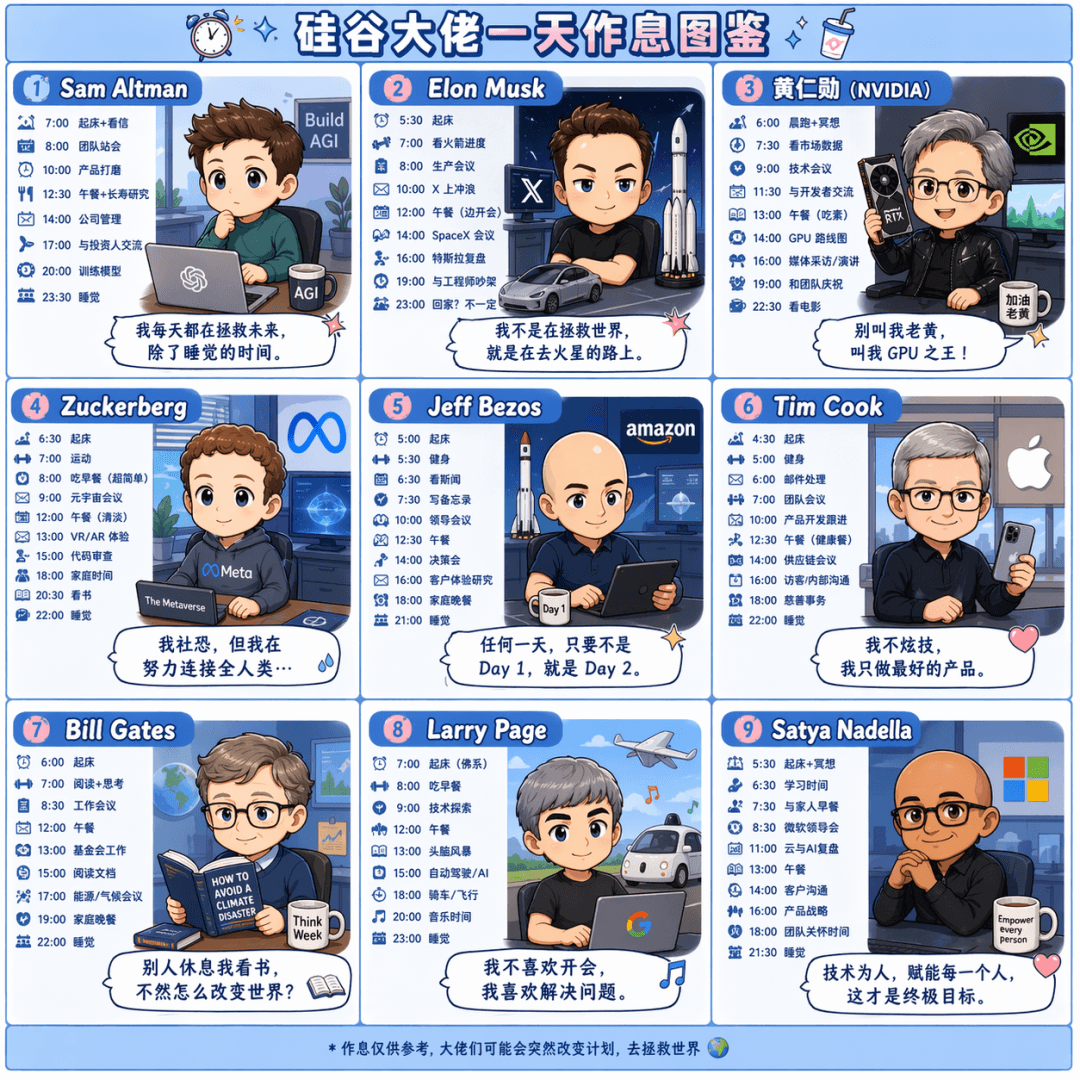
The prompt is to draw a Q-version cartoon nine-square grid called "A Day's Workbook of Silicon Valley Bosses". Draw the daily schedules of Sam Altman, Elon Musk, Jen-Hsun Huang, Zuckerberg, Jeff Bezos, Tim Cook, Bill Gates, Larry Page, and Satya Nadella respectively. Each box is equipped with a time and a comment dialog box, in pink and blue colors.

Strategy long picture #5

Strategy long picture #5

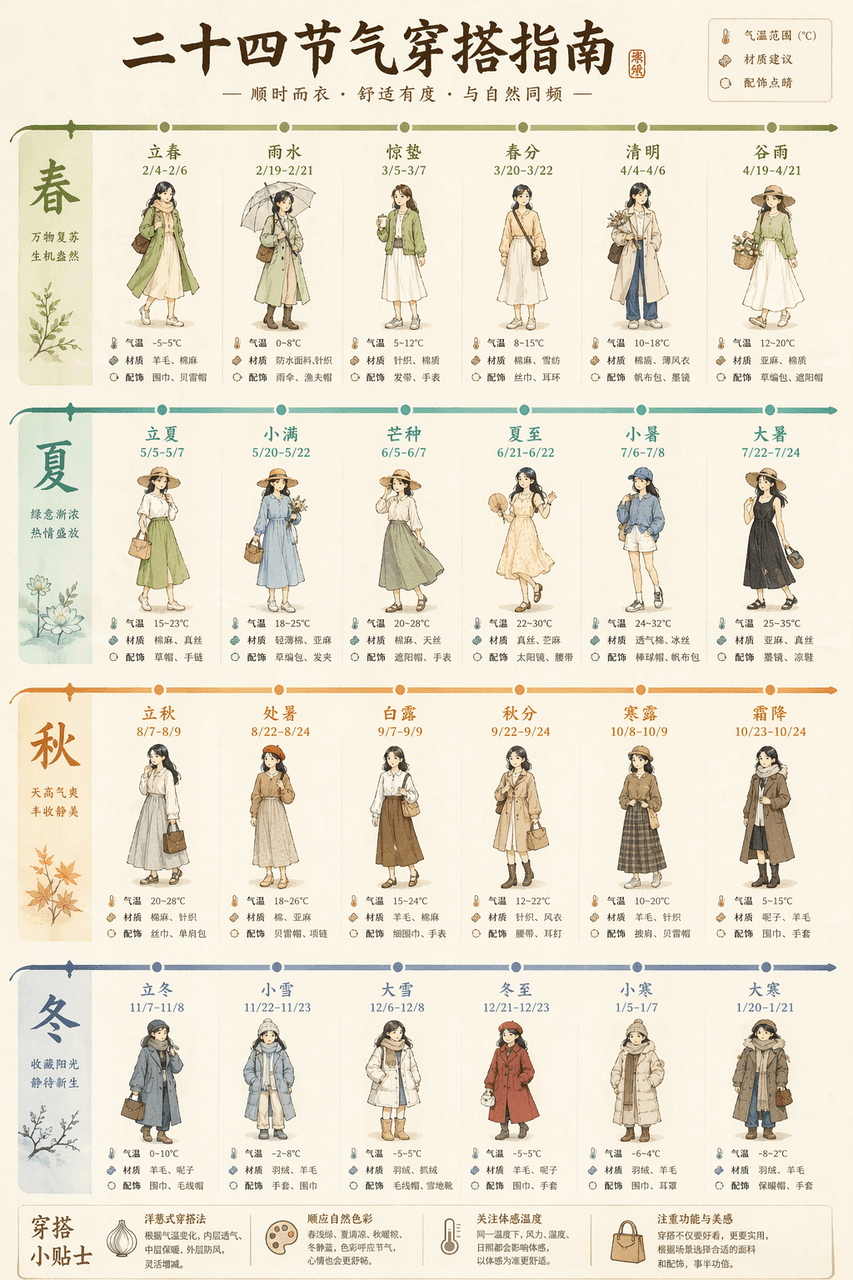
Draw a long picture "Guide to Outfits for the Twenty-Four Solar Terms", with a horizontal timeline running through the whole picture. For each solar term, a small puppet shows the outfit for that day, with temperature ranges, material recommendations, and accessories highlighted. Light beige base with twenty-four gradient colors.

Strategy long picture #4

Strategy long picture #4

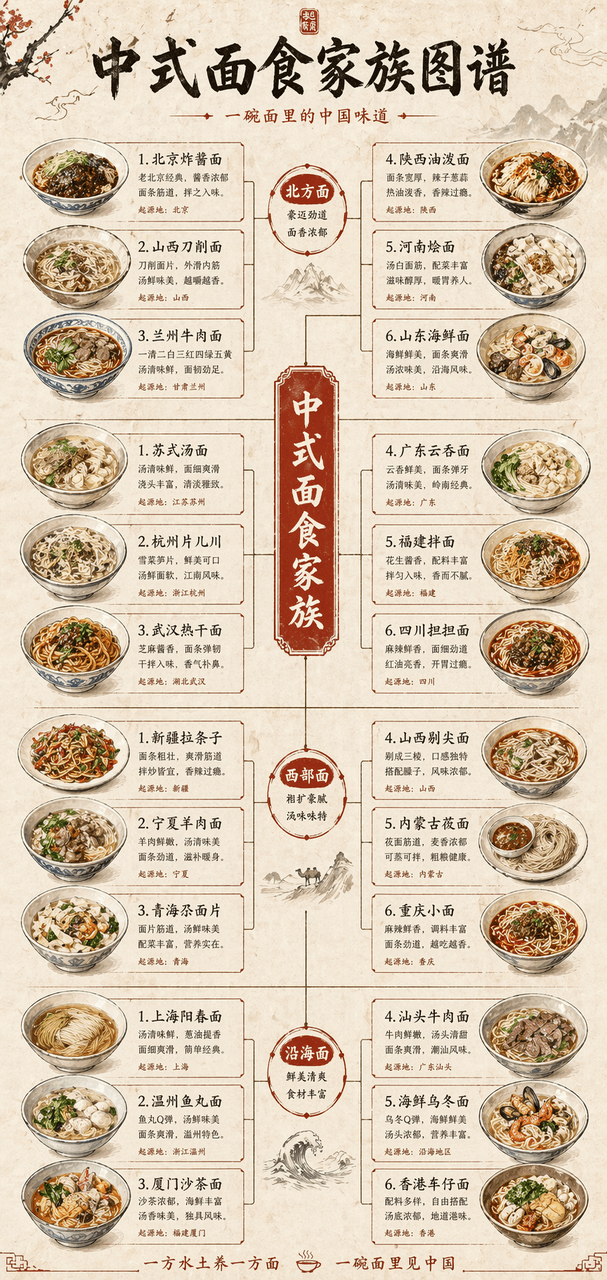
Draw a long vertical picture of the "Chinese Noodle Family Tree", showing the four branches of northern, southern, western and coastal noodles like a family tree. Each branch extends to five to six kinds of noodles, with hand-drawn illustrations of noodle bowls. The rice paper background is decorated with vermilion.

Strategy long picture #3

Strategy long picture #3

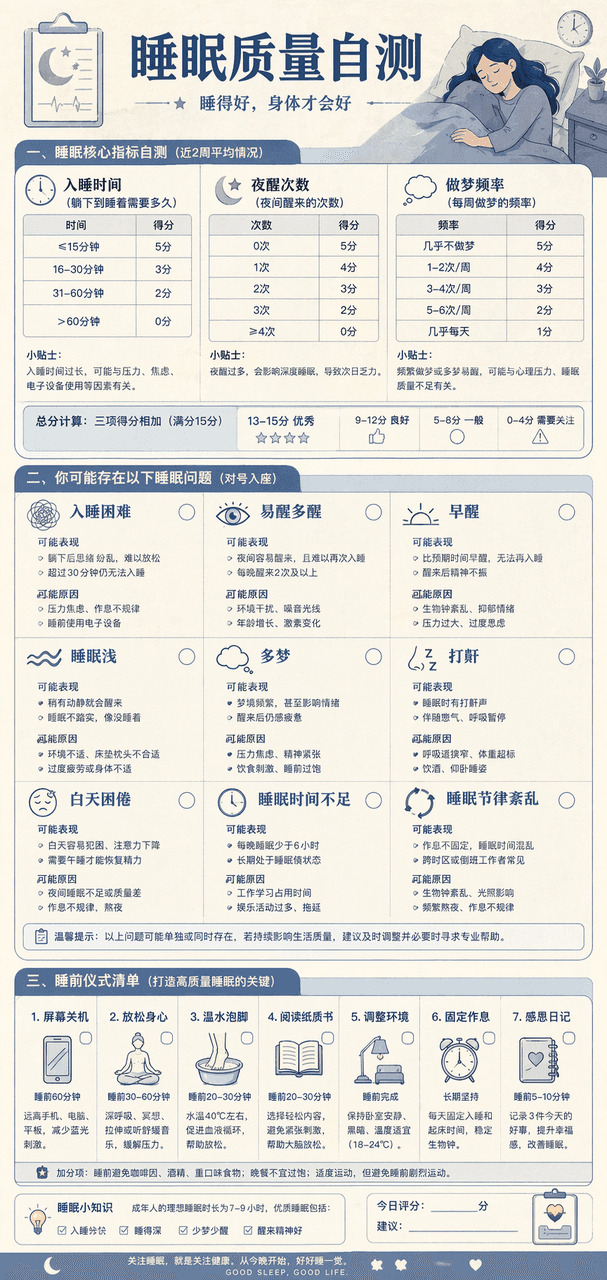
Draw a "Sleep Quality Self-Assessment Chart". At the top are three self-assessment tables, including the time it takes to fall asleep, the number of night awakenings, and the frequency of dreams. In the middle, nine common sleep problems are listed, and at the bottom is a list of pre-sleep rituals. The Morandi blue color scheme resembles the design of a medical examination report.

Strategy long picture #2

Strategy long picture #2

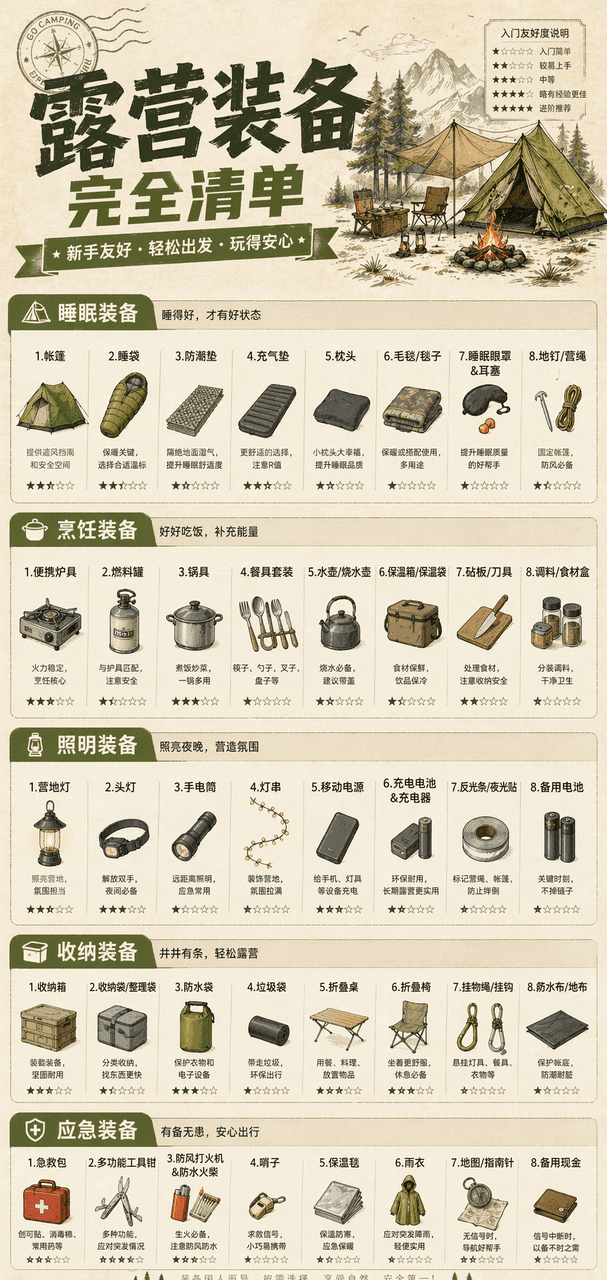
Draw a vertical "Complete List of Camping Equipment" infographic, divided into five modules: sleeping, cooking, lighting, storage, and emergency. Each module lists seven to eight specific pieces of equipment, with small icons and entry-friendliness stars. Khaki green main color, paper texture background.

Strategy Long Picture #1

Strategy Long Picture #1

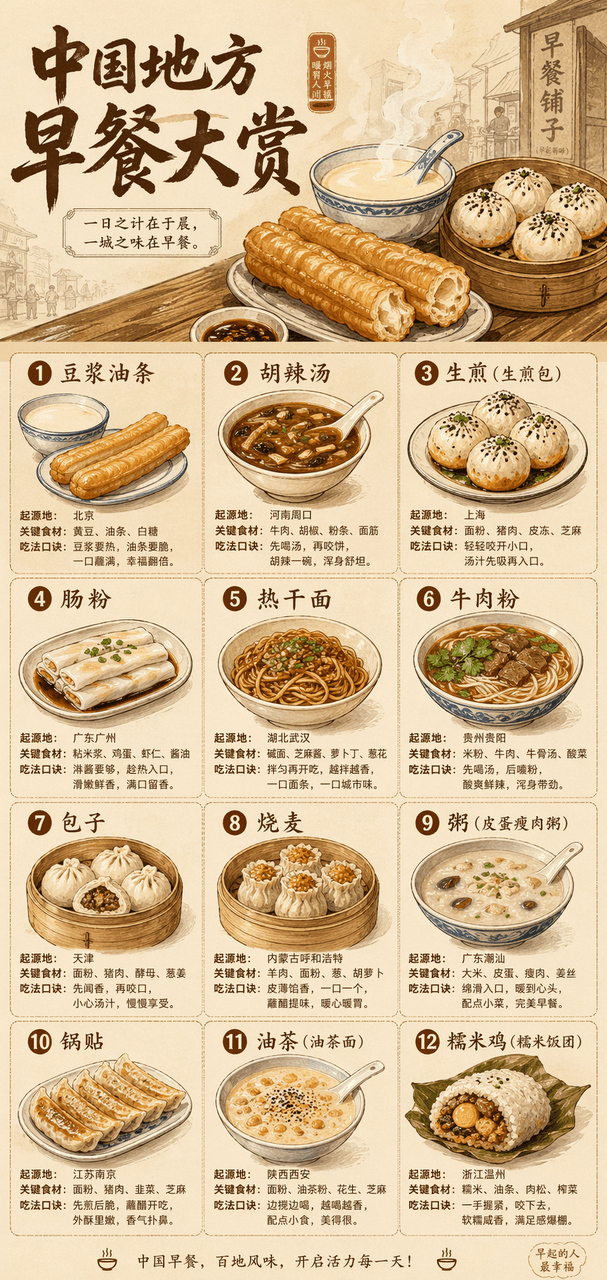
Draw a long vertical picture with the theme "China Regional Breakfast Awards". The large title at the top is accompanied by a steaming hand-drawn illustration, and a grid is used below to display twelve types of breakfast, including soy milk fried dough sticks, spicy spicy soup, fried noodles, rice rolls, hot dry noodles, and beef noodles. Each type is accompanied by a small illustration, place of origin, key ingredients, and eating tips. Beige base with warm brown, the overall look is like a designer print.

Landmark Technical Annotation Information Tour

Landmark Technical Annotation Information Tour

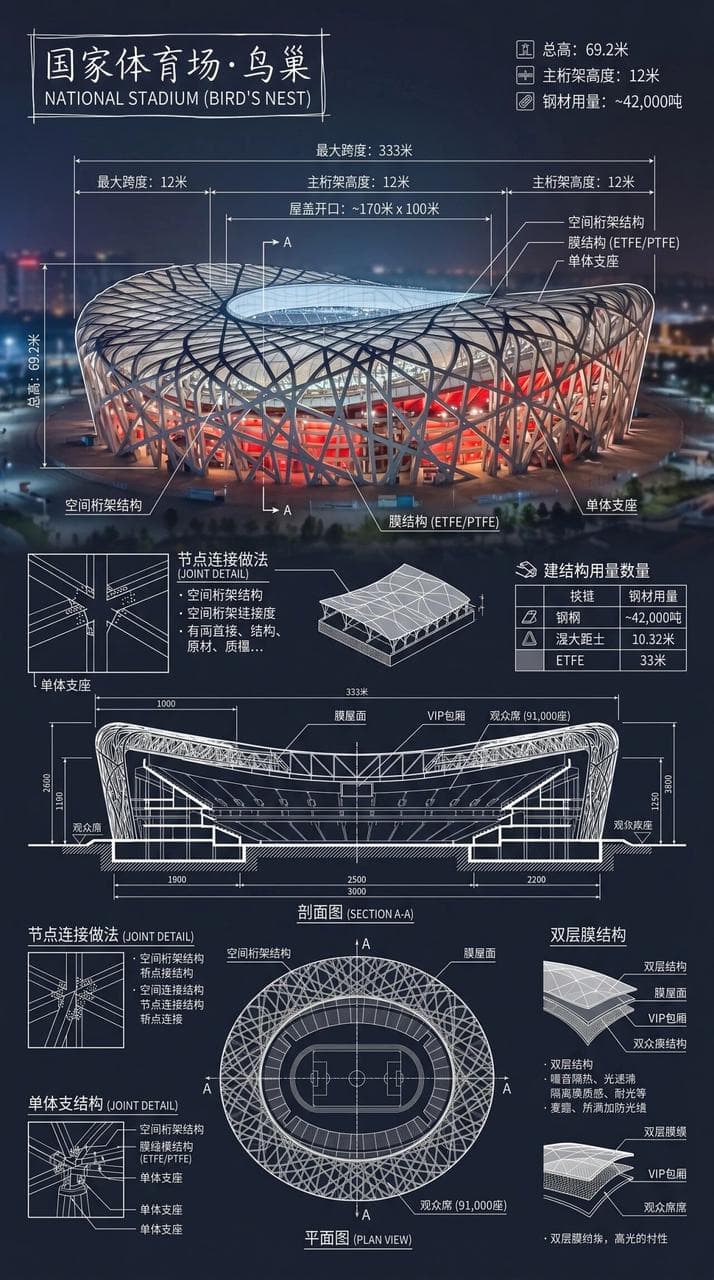
Create an infographic of the National Stadium·Bird's Nest. Combine real photos of landmarks with white technical note overlays and write the building name in a hand-drawn box in the corner. The picture is superimposed with complex and clear white technical annotations, showing key structural data, important measurements, material quantities, detailing methods, and including sections, plans, and significant architectural and engineering features, and integrated into a complete overview long picture. The white lines are detailed and clear, the real environment is visible, the vertical composition is professional, rational and readable.

Product comparison chart

Product comparison chart

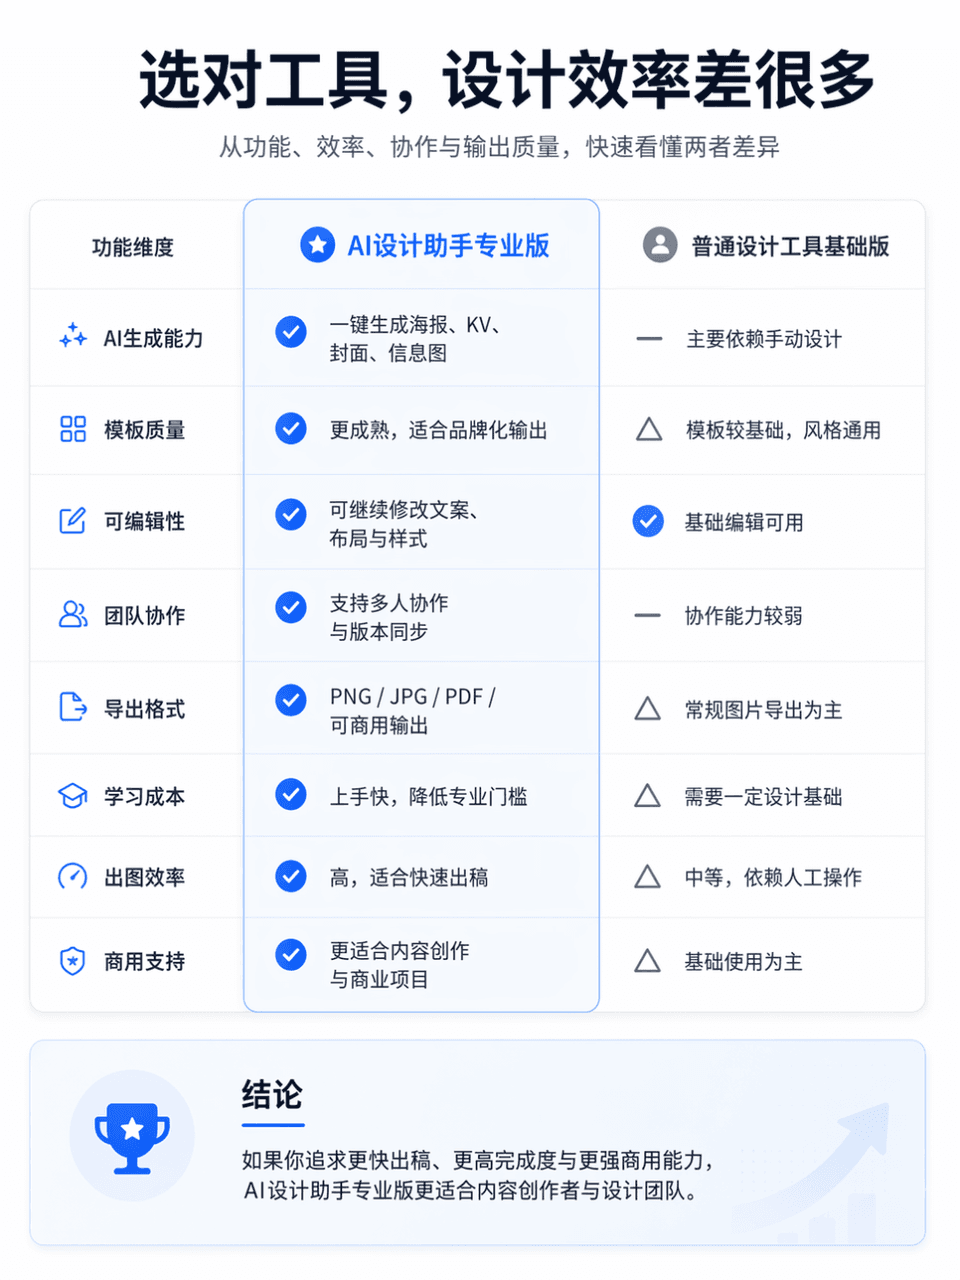
The frame size is 3:4, and a professional and clear product function comparison chart is generated. The comparison object is AI Design Assistant Professional Edition vs. General Design Tool Basic Edition. The overall layout is divided into left and right columns for comparison. The left side is "AI Design Assistant Professional Edition" and the right side is "General Design Tool Basic Edition". Place an eye-catching main title at the top of the screen, "Choose the right tool, and the design efficiency will be much different." The subtitle can be supplemented with "Quickly understand the differences between the two in terms of functionality, efficiency, collaboration, and output quality." The overall style refers to the product comparison page of the official website, which requires a simple layout, clear information hierarchy, sufficient white space, modern fonts, restrained and advanced color matching, and the visual texture of a real Internet product official website. You can add slight icons, dividers, card shadows and key highlights, but avoid e-commerce promotions, clutter, and low-quality tables.

Method flow chart

Method flow chart

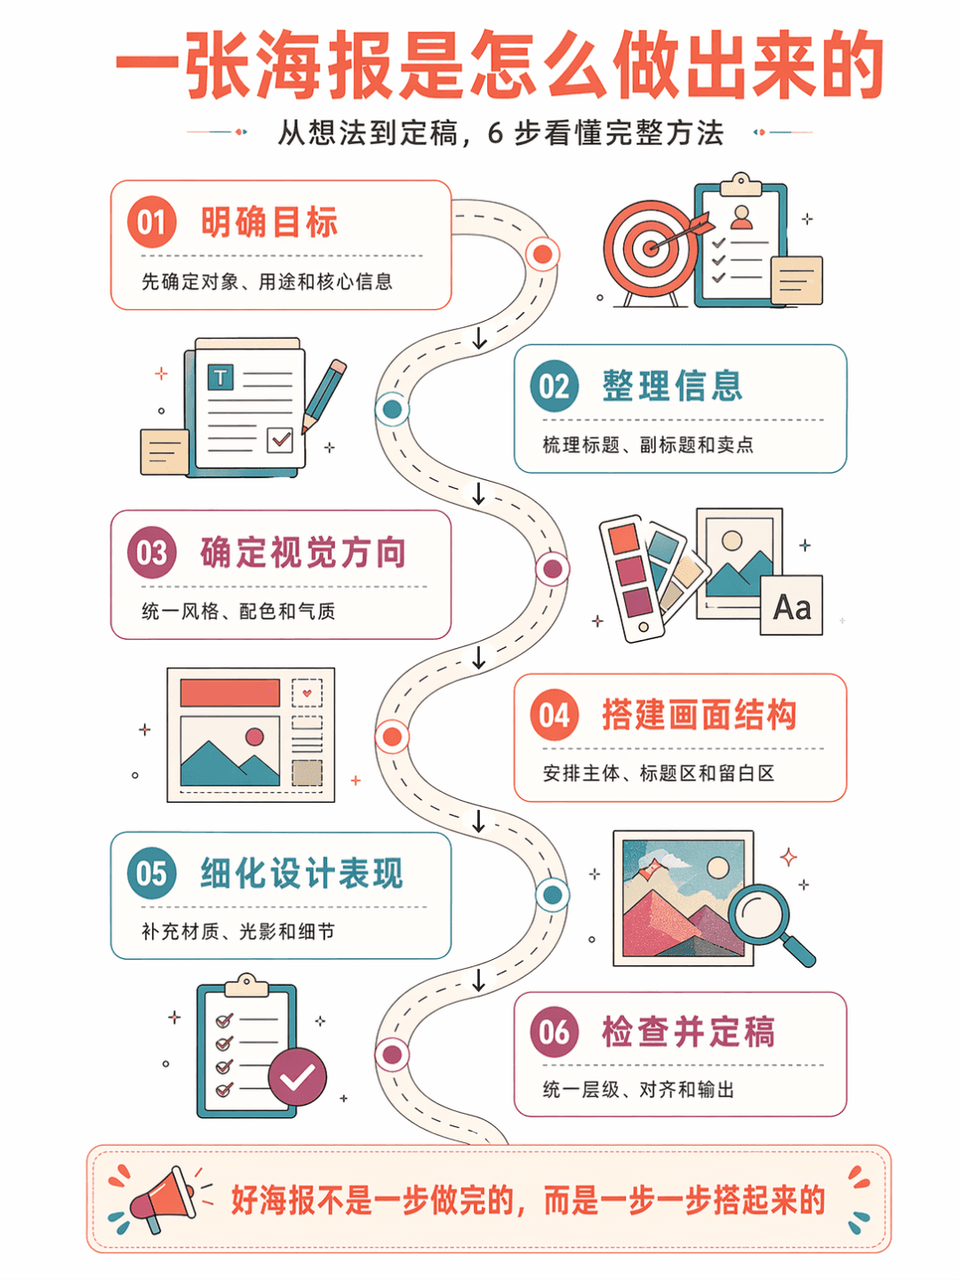
Generate vertical method flow chart poster "AI Poster Production Flow Chart", summarizing 6 steps. The style is: large white space on a white background, series of steps on a curved road, isometric information illustration, retro flat geometric style, coral orange + lake blue + purple red color scheme, thin line strokes, refreshing and orderly. Each step includes a number, title, short description, and arrow connections. The Chinese language is accurate, has a strong tutorial feel, and is suitable for course illustrations.

Data summary long chart

Data summary long chart

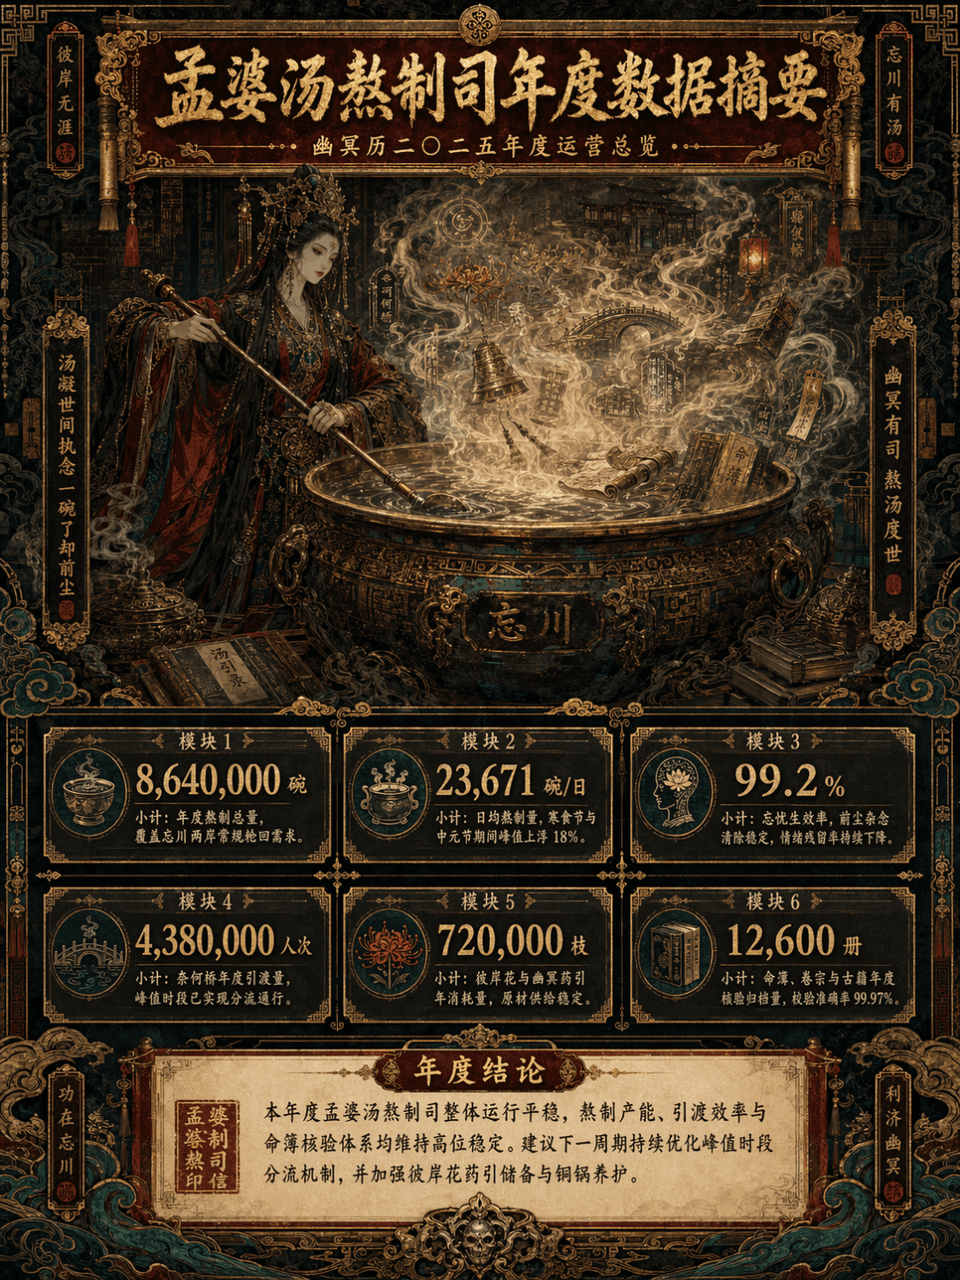
Picture frame 3:4, create a long vertical data summary picture with the theme of "Annual Data Summary of Meng Po Soup Making Department". The main subject is Meng Po cooking soup in front of a huge copper pot. The steam is surging. In the mist of the soup, there are faintly visible Bana flowers, Naihe Bridge, lanterns, runes, scrolls, copper bells, ancient books, fortune books, clouds and ghost patterns. The overall design adopts a maximalist style, but the information level must be clear, such as the combination of consulting report visualization + Oriental Monster setting set + advanced exhibition long picture. The picture is a long vertical version of the infographic, with the title area at the top, the main visual area in the middle, the data module area at the bottom, and the conclusion area at the bottom unfolded layer by layer. The color scheme is controlled to the four main colors of dark vermilion, gilt, jet black, and peacock green, with partial embellishments of old paper off-white and patina green. The picture is gorgeous, complex, mysterious, and solemn, but it cannot be chaotic and out of control. It must be high-end, orderly, and have strong decorative aesthetics.

Teaching Illustrated Posters

Teaching Illustrated Posters

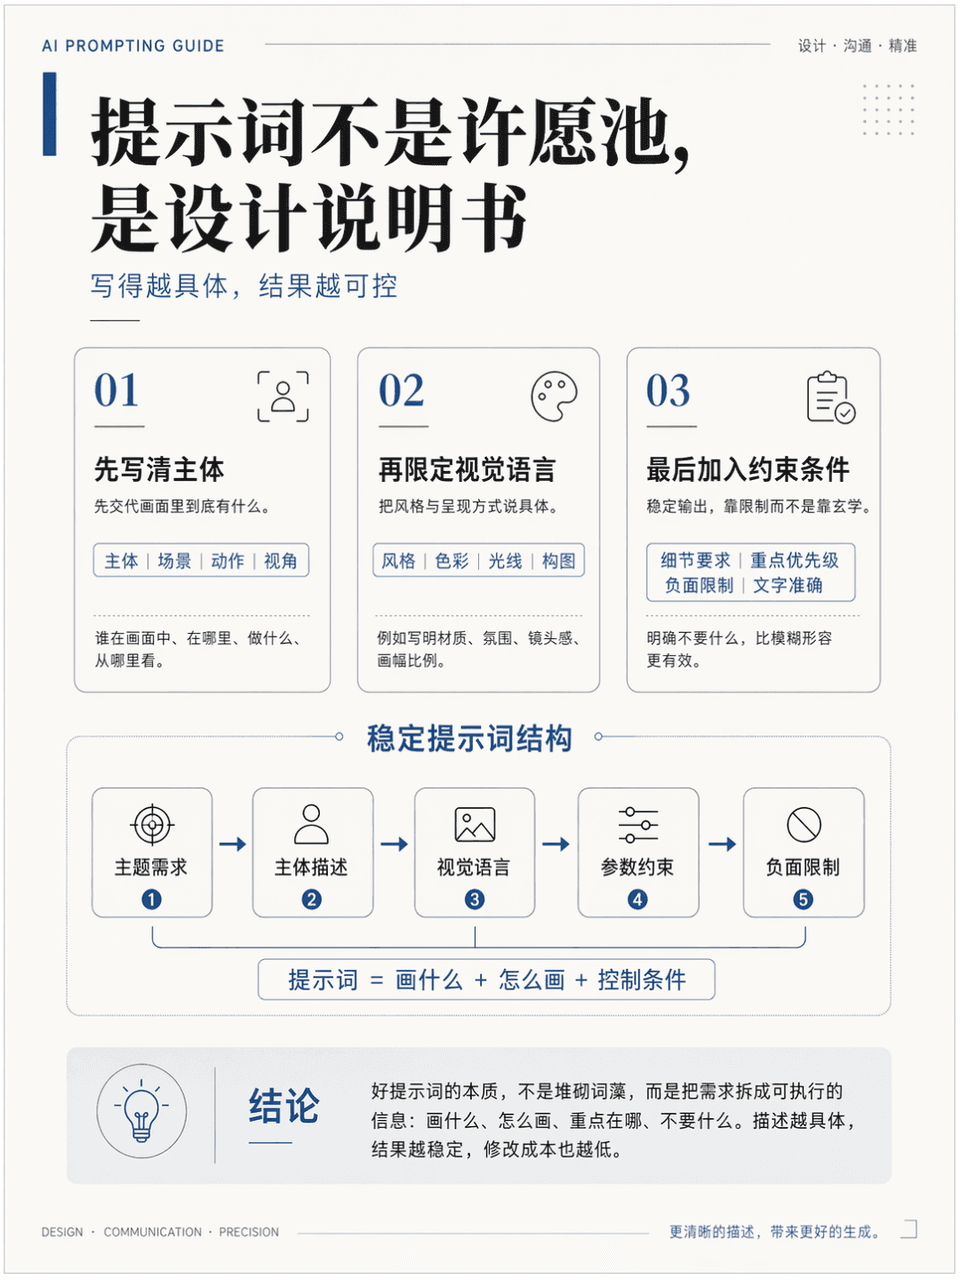
The frame size is 3:4, and a vertical teaching illustration poster is generated to explain the knowledge point "How to write more stable AI drawing prompts". It needs to include a title, 3 key modules, 1 core diagram, and 1 conclusion area. The title is "The prompt is not a wishing well, it is a design instruction". It looks like a high-quality course handout page. It is professional, clean, and academic. It also has a sense of advanced design. The Chinese language is accurate, the hierarchy is clear, the layout is restrained, and there is sufficient white space.

Thesis technology roadmap

Thesis technology roadmap

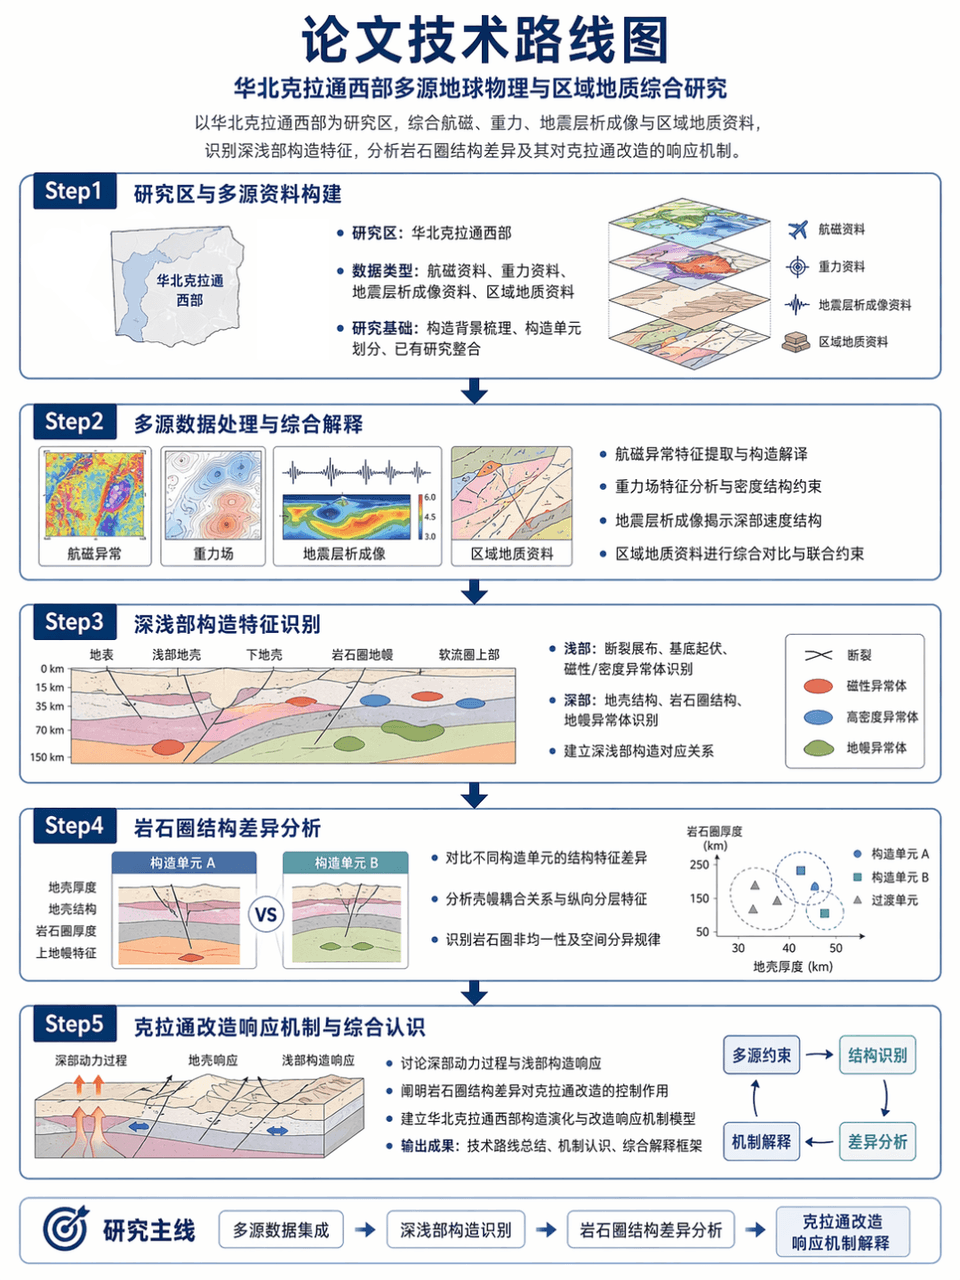
Picture frame 3:4, generate the technical roadmap of the thesis: taking the western part of the North China Craton as the research area, integrating aeromagnetic, gravity, seismic tomography and regional geological data, identifying the deep and shallow structural characteristics, and analyzing the differences in lithospheric structure and its response mechanism to the craton transformation. Use a Step1-Step2-Step3-Step4-Step5 structure, with clear arrows, accurate terminology, and restrained and professional layout.

Technology infographic

Technology infographic

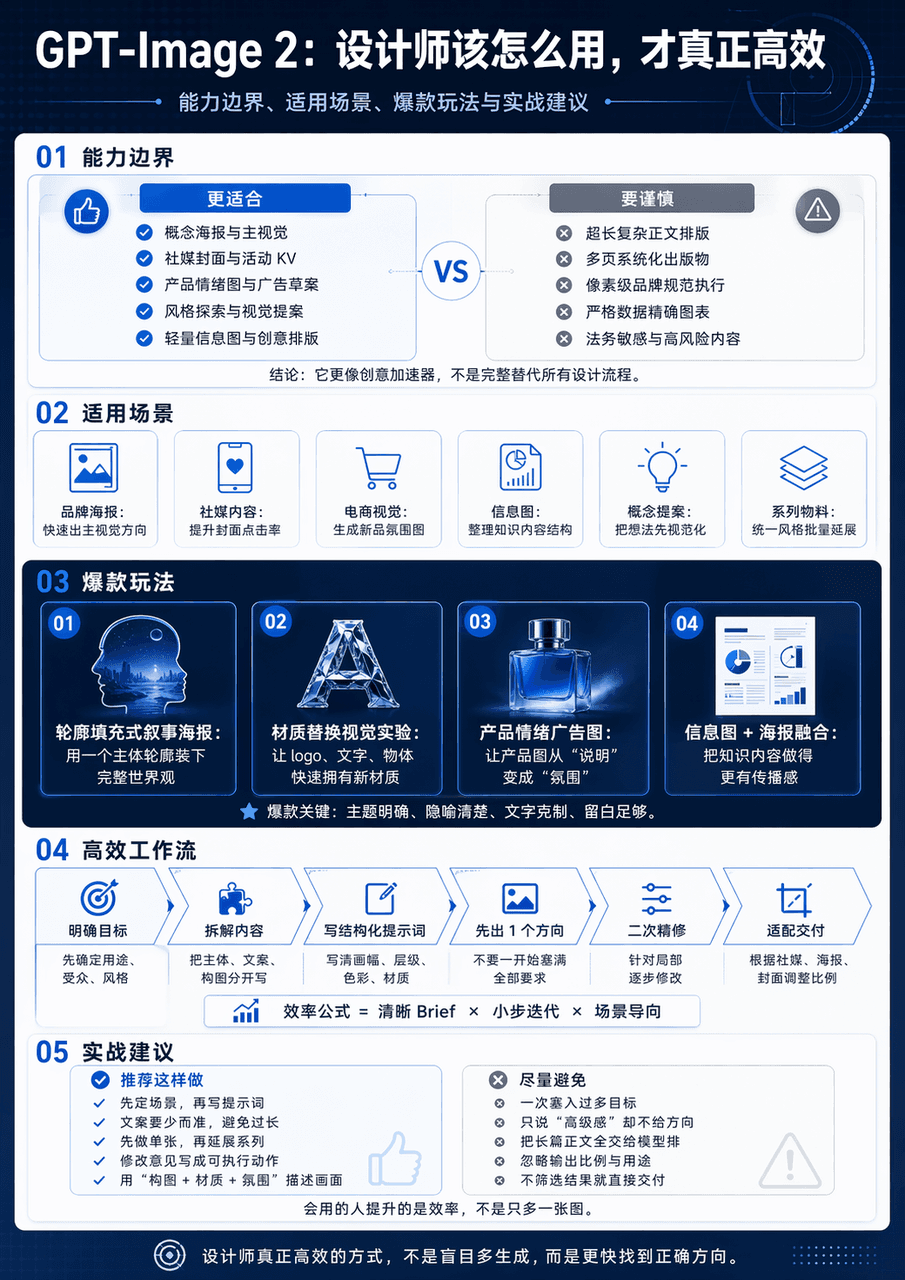
Generate a vertical science and technology information map with the theme of GPT-Image 2 Design Application Guide. The whole map is divided into 5 modules. The big title "GPT-Image 2: How should designers use it to be truly efficient" is set at the top. The subtitles are capability boundaries, applicable scenarios, popular gameplay and practical suggestions. The middle diagram adopts the form of minimalist interface card + process arrow + comparison structure chart. The information level is clear and the visual center is clear.

Potted Plant Mood Diary

Potted Plant Mood Diary

"Weekly Diary of the Emotions of Potted Plants" is a combination of a handbook style diary and plant observation illustrations. The 7-day vertical page records the light, water volume, leaf status, number of new shoots, owner's mood, weather and a small confession. The protagonist is a pot of green plants by the window. The style is quiet and healing, with a ratio of 9:16.

Late-Night Subway Guide Poster

Late-Night Subway Guide Poster

"A comforting guide for passengers on the last subway train" combines public service visuals with humane copywriting. The image looks like a public welfare poster at a subway station. The content includes the last train time, night transfers, taxi spots, emergency telephone numbers, hot drink vending machines, and suggestions for home routes. It also adds gentle copywriting "Thank you for your hard work, please go home safely today", with a ratio of 4:5.

"Illustrated Tools for Street Shoe Repair Shops"

"Illustrated Tools for Street Shoe Repair Shops"

"Illustrated Tools of a Street Shoe Repair Shop" combines craft anthropology with still life photography. The main picture is an overhead shot of an old craftsman's workbench. Shoe lasts, pliers, needlework, glue, polishing cloth, shoe sole samples, and account books are presented like specimens. Each tool is accompanied by a small handwritten note describing its traces of use and age. The ratio is 4:5.

Fantasy Botanical Field Journal

Fantasy Botanical Field Journal

"Magic Plant Greenhouse Observation Log: Glowing Ferns" is a fusion of scientific research archives and fantasy plant illustrations. The left side shows the different growth stages of plants and the comparison of day and night luminous intensity. The right side shows greenhouse environmental parameters, leaf macro, root system profiles and care suggestions. The whole thing looks like a serious botany poster, but the object comes from a fantasy world, with a ratio of 4:5.

"Urban Tree ID Card System"

"Urban Tree ID Card System"

"Urban Tree ID Card System" is a visual fusion of public ecological design and archives. The picture shows the trees on both sides of the street. A minimalist information sign is erected in front of each tree to record the age of the tree, tree species, flowering time, shade index, bird preference, and suitable walking period. On the right side are the design specifications and QR code interface of the sign, with a ratio of 16:9.

“Genealogy of the Chinese Dim Sum Universe”

“Genealogy of the Chinese Dim Sum Universe”

"Chinese Dessert Universe Genealogy" is a combination of museum-style information graphics and high-end food photography. In the center is a star chart-like structure. Moon cakes, mung bean cakes, Dingsheng cakes, peach cakes, donkey rolls, horseshoe cakes, etc. are arranged like constellation nodes. The connecting lines mark the relationship between region, festival, taste and craftsmanship. There is a close-up of the food next to each node. The title is solemn and grand, with a ratio of 4:5.

Rainy Season Weather Diary

Rainy Season Weather Diary

"Designing a visual weather diary for the rainy season", the handbook page is integrated with the weather chart. The vertical screen is composed of weather entries for 14 consecutive days. Each day includes cloud cover, rainfall, clothing dryness index, mood icons, today's suitable food, and window observation vignettes. The layout is exquisite, like a very healing independent publication, with a ratio of 9:16.

Commercial Kitchen Workflow Infographic

Commercial Kitchen Workflow Infographic

"Chinese restaurant back kitchen moving line overview" combines catering industrial design with documentary kitchen photography, overlooking a busy but orderly back kitchen, forming a clear closed loop from washing, cutting, preparing, frying, serving, passing dishes to recycling. Peak hours, pot firepower, food preparation turnover and safety tips are listed next to it. The overall professional, enthusiastic and full of fireworks, with a ratio of 16:9.

Urban Laundry Anthropological Infographic

Urban Laundry Anthropological Infographic

"Research on the Aesthetics of the Clothes Drying System of Mountain City Residents" combines social observation photography with design illustrations. Clothes of different colors and materials are dried on the balconies in layers. The picture uses thin lines and small labels to analyze the structure of the clothes drying pole, space utilization, color rhythm, and weather response. The title is like a calm anthropology magazine, with a ratio of 4:5.

Hand-Pulled Noodle Mechanics Poster

Hand-Pulled Noodle Mechanics Poster

"Poster on Mechanical Analysis of Hand-pulled Noodles" combines food photography with scientific illustrations. The main picture is a freeze-frame of a chef's continuous movements of stretching noodles. Parameters such as stretching, torsion, rebound, thickness uniformity, dough moisture content, etc. are marked with thin lines on the side. The background is a mist-filled kitchen. The title is serious and professional, with a ratio of 4:5.

"Moon Nursery Schedule"

"Moon Nursery Schedule"

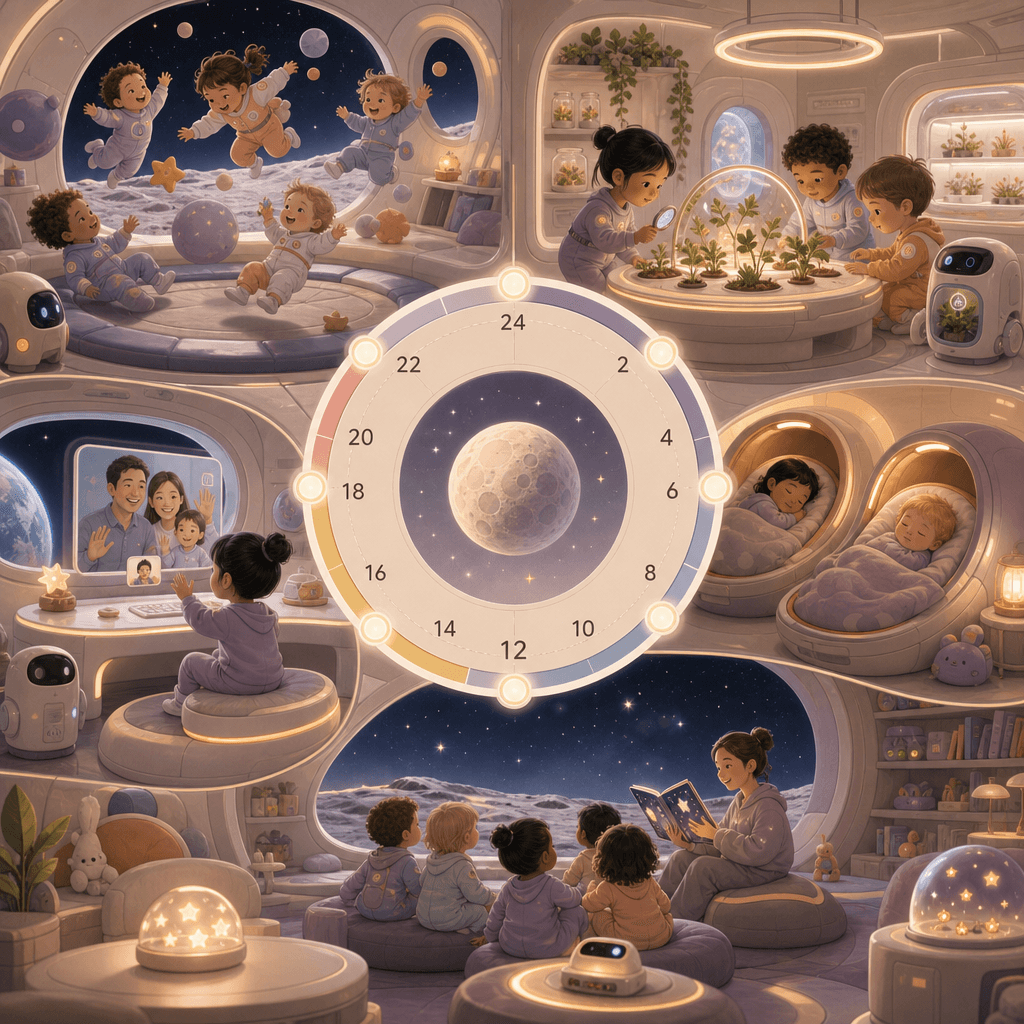
"Moon Nursery Schedule" combines children's space design with a future world view. The screen adopts a circular 24-hour orbital timeline. The nodes include low-gravity games, aerospace plant classes, nap cabins, earth video calls, and starry sky story time. It is accompanied by small scene illustrations and equipment diagrams. The colors are gentle. It is not a cold science fiction but a future with living temperature. The ratio is 9:16.

Sustainable Fishing Port Infographic

Sustainable Fishing Port Infographic

"New Energy Fishing Port Daily Operation Diagram" combines industrial space photography with sustainable industry information graphics. The fishing port in the morning fog is equipped with solar roofs, electric cold chain vehicles, seafood sorting platforms, and wind power lighthouses. On the right side are energy consumption, fishing species, supply cycles, and weather forecast modules. It has a simple and professional temperament, with a ratio of 16:9.

"Make one's childhood into a theme park map"

"Make one's childhood into a theme park map"

"Make one's childhood into a theme park map", the memory narrative is integrated with the park guidance system, and the picture is presented in a cute flat map style: the old community slide area, the concession stand area, the afternoon cicada chirping forest area, the cartoon theater area in front of the TV, the summer homework maze area, and the grandma's kitchen dessert station. Each area is equipped with detailed illustrations and nostalgic text, just like a real theme park map single page, with a ratio of 4:5.

"Late Night Radio Program Schedule"

"Late Night Radio Program Schedule"

"Late Night Radio Program List" combines sound media with editorial schedule design. The screen is like a radio station's all-night program list. From 22:00 to 05:00, it is divided into "overtime with you, for insomniacs, anonymous stories, city wind, and daybreak." Each column is decorated with minimal illustrations and waveforms, and the background is dark studio equipment. The ratio is 9:16.

"Twelve Greens of Spring" Visual Dictionary

"Twelve Greens of Spring" Visual Dictionary

The "Twelve Greens of Spring" visual dictionary combines a color sample book with a nature observation poster. The picture is composed of 12 vertical color strips, corresponding to names such as "new willow green, moist moss green, matcha green, glass bottle green, green plum green, and after-rain leaf green". Each color strip is accompanied by a macro photo and an emotional description. The layout is minimalist and advanced, like a designer's inspiration board, with a ratio of 9:16.

“The Urban Night Runner’s Gear Guide 2026”

“The Urban Night Runner’s Gear Guide 2026”

"Urban Night Runner Equipment Guide 2026" combines product display with lifestyle posters. The main screen is a front view of a night runner's full body equipment. Shoes, reflective vests, bone conduction headphones, arm bags, water bottles, and heart rate rings are marked with thin lines. Next to them are heart rate zones, urban routes, and nighttime lighting recommendations. The color scheme is dark blue with fluorescent green, like a sports brand technical manual, and the ratio is 9:16.

“Chinese Wedding Color Archives”

“Chinese Wedding Color Archives”

"Chinese Wedding Color Archives" combines traditional etiquette with modern editorial formats. The picture is divided into five modules: "rouge red, gold thread yellow, jade white, ebony black, and pomegranate pink" to display wedding clothes, utensils, pastries, invitations, flowers and patterns. The central title is like a high-end wedding magazine feature, with very short notes around it explaining the symbolic meaning behind each color. The overall design is solemn and exquisite, with a ratio of 4:5.

“Social heat map of hot pot restaurants”

“Social heat map of hot pot restaurants”

"Social Heat Map of Hot Pot Restaurants" combines catering space design with social behavior analysis. It takes an overhead shot of the floor plan of a lively hot pot restaurant. Different seating areas are marked as "family reunion area", "colleague dining area", "ambiguous trial area", "friends complain area" and "alone get off work recovery area". The heat map shows spiciness, drink consumption and laughter density. The style is humorous and professional, with a ratio of 16:9.

"Air Profile of a Used Bookstore"

"Air Profile of a Used Bookstore"

"Air Section of an Old Bookstore" is a fusion of spatial narrative and conceptual information graphics. The picture cuts a cross-section of an old bookstore. Different layers of air are filled with visual symbols of paper dust, coffee aroma, umbrella dripping, page turning sound waves, and the creak of the wooden floor. These "invisible components" are annotated with academic style labels next to it. The title is very poetic and the ratio is 3:4.

“The Economics of a Breakfast Stall”

“The Economics of a Breakfast Stall”

"The Economics of a Breakfast Stall" is an infographic poster combined with street photography. The center of the picture is a perspective view of a steaming pancake stall. The cost components are listed on the left: batter, eggs, crackers, sauces, stall fees, labor, and rainy weather losses. The right side is the curve of queue length and table turnover speed during peak hours. At the bottom is written "Why are some people willing to walk two more streets for a hot mouthful of steam?" The whole thing is both down-to-earth and highly designed, with a ratio of 4:5.

Island Typhoon Preparation Infographic

Island Typhoon Preparation Infographic

"Island Typhoon Preparation Checklist 12 hours before" is an emergency poster integrated with a travel lifestyle magazine. The center of the picture is a cross-sectional view of an island B&B. Steps such as window reinforcement, water storage, lighting preparation, garden tidying, suspension notice, and kitchen food storage are marked with numerical labels. The sidebar has a wind speed grade ribbon and a timeline. The title is minimalist and eye-catching. The overall design is practical and visually attractive, with a ratio of 4:5.

Ryokan Daily Operations Timeline

Ryokan Daily Operations Timeline

"One day operation panel of a mountain hot spring hotel" combines hospitality service design with lifestyle photography. The vertical timeline starts from 6:00 cleaning, 10:00 welcome, 15:00 check-in, 18:00 dinner, 21:00 private bath, 23:30 lights out. It is equipped with small scene illustrations and simplified data at each time point such as passenger flow, hot water energy consumption, towel replacement volume, etc. The title is elegant and calm, and the color scheme refers to wood color, fog blue, and hot spring white steam. The proportions 9:16.

Jiangnan Garden Night Tour Guide Book

Jiangnan Garden Night Tour Guide Book

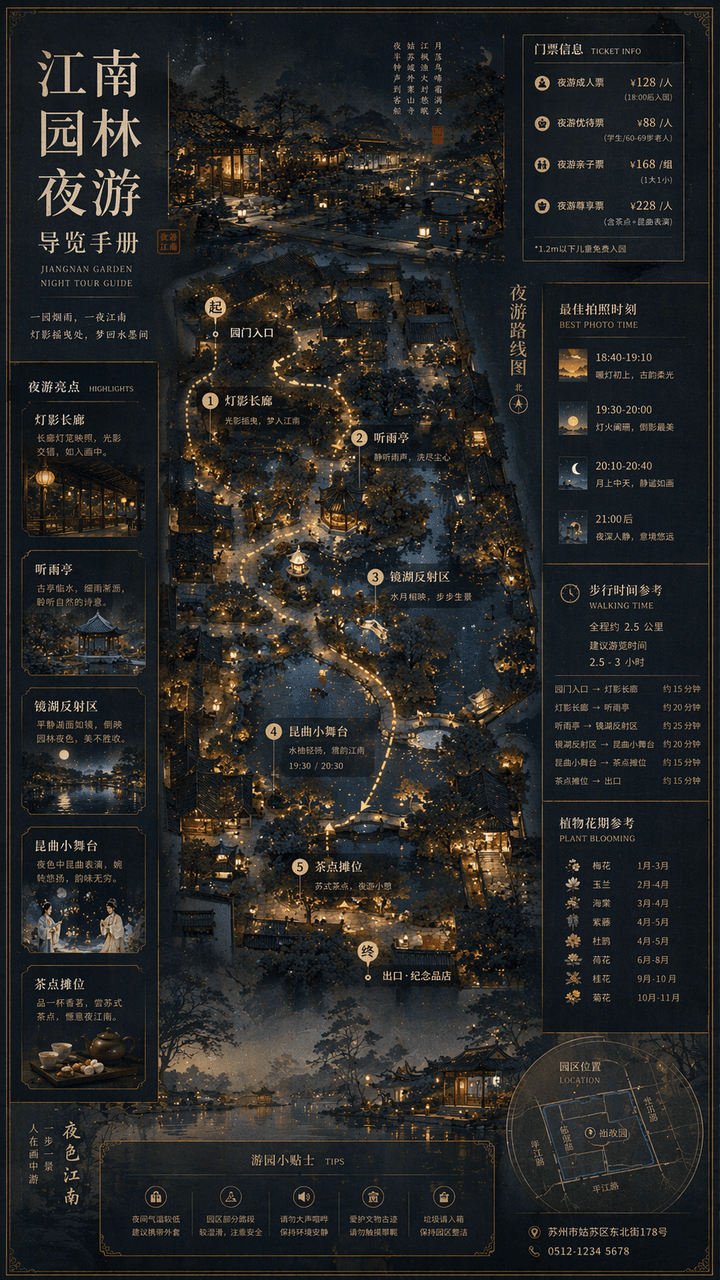
"Jiangnan Garden Night Tour Guide Manual" combines traditional landscape paintings with modern cultural tourism map systems. The main screen is an overhead view of the garden plus a partial perspective view, marking the night tour route, lantern spots, listening to the rain pavilion, mirror lake reflection area, Kunqu opera performance small stage and refreshment stalls. The sidebar includes ticket levels, best photo moments, walking time, and plant flowering periods. The font is a combination of Song Dynasty and modern fine black, and the overall elegant and precise ratio is 9:16.

Finals Week Library Survival Infographic

Finals Week Library Survival Infographic

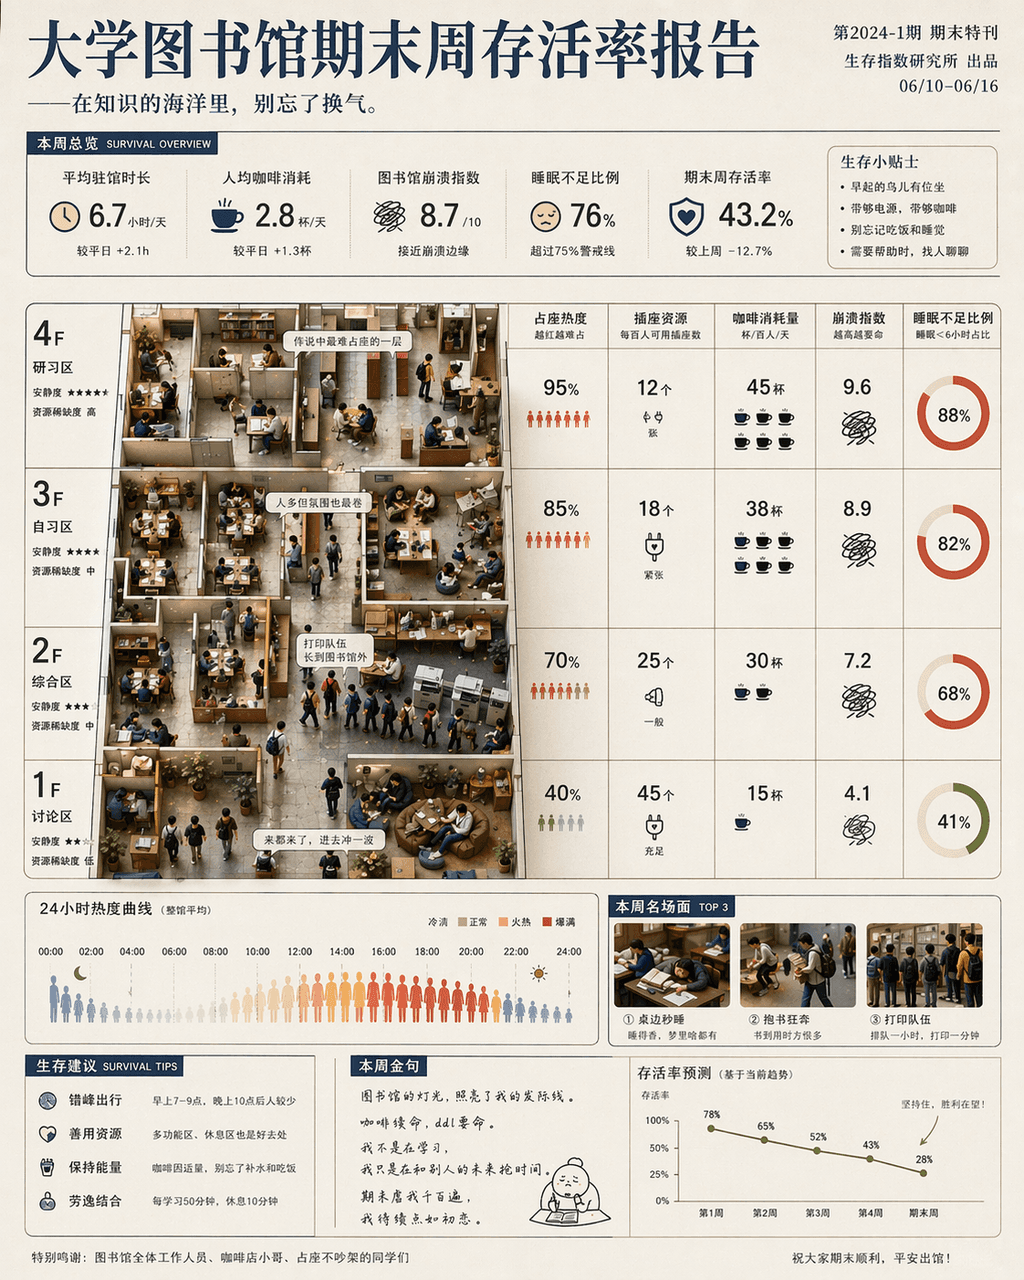
"University Library Final Week Survival Rate Report" is a fusion of humorous data posters and campus life photography. The main screen is based on the library floor plan, with seat occupation heat, socket resources, coffee consumption, crash index and sleep deprivation ratio marked by floor and time. Miniature scenes of students are partially embedded: running with books, falling asleep at the table, and the printing queue is too long. The title is serious, and the subtitle is slightly teasing, with a ratio of 4:5.

90-minute urban therapy trail after get off work

90-minute urban therapy trail after get off work

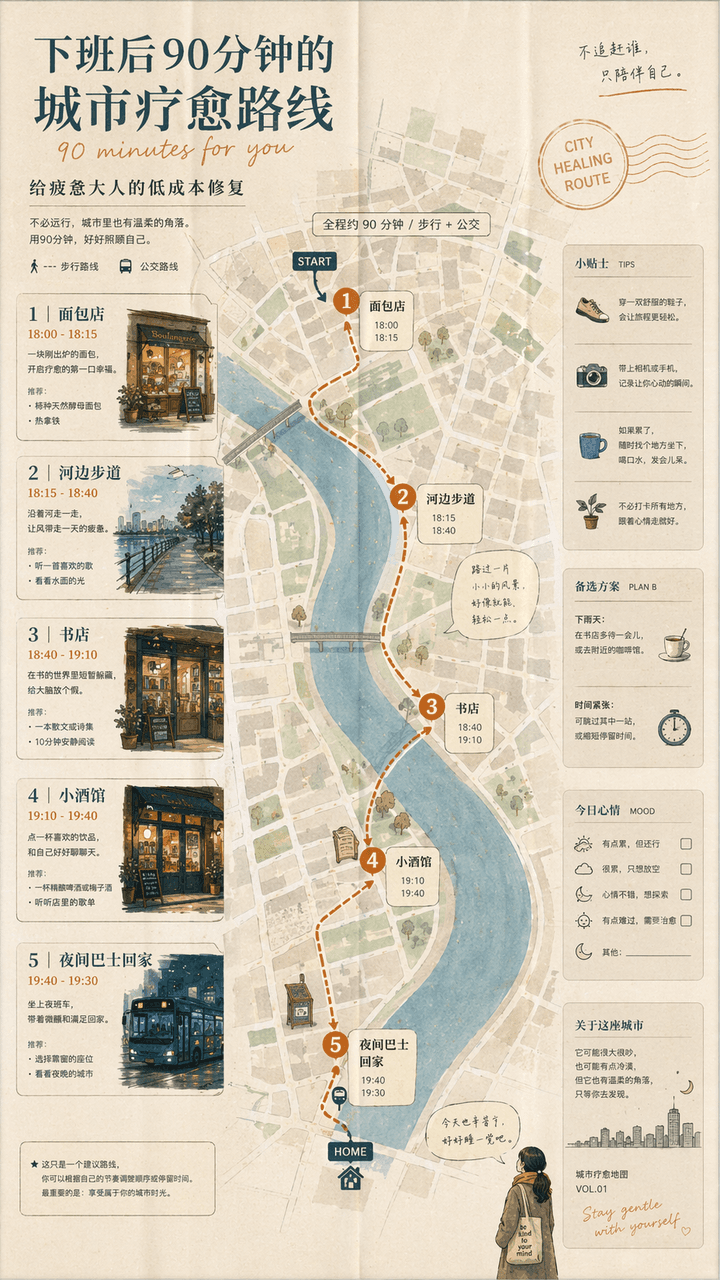
"A 90-minute urban healing route after get off work" is a combination of a lifestyle map and a guidebook. The screen unfolds like a foldable city map: the first stop is a bakery, the second stop is a riverside walk, the third stop is a bookstore, the fourth stop is a bistro, and the fifth stop is a night bus home. The route is marked with small illustrations and time suggestions. The title is gentle, and the subtitle reads "Low-cost fix for tired adults". The whole thing looks like an independent city guide magazine, with a ratio of 9:16.

Coffee Brewing Competition Infographic

Coffee Brewing Competition Infographic

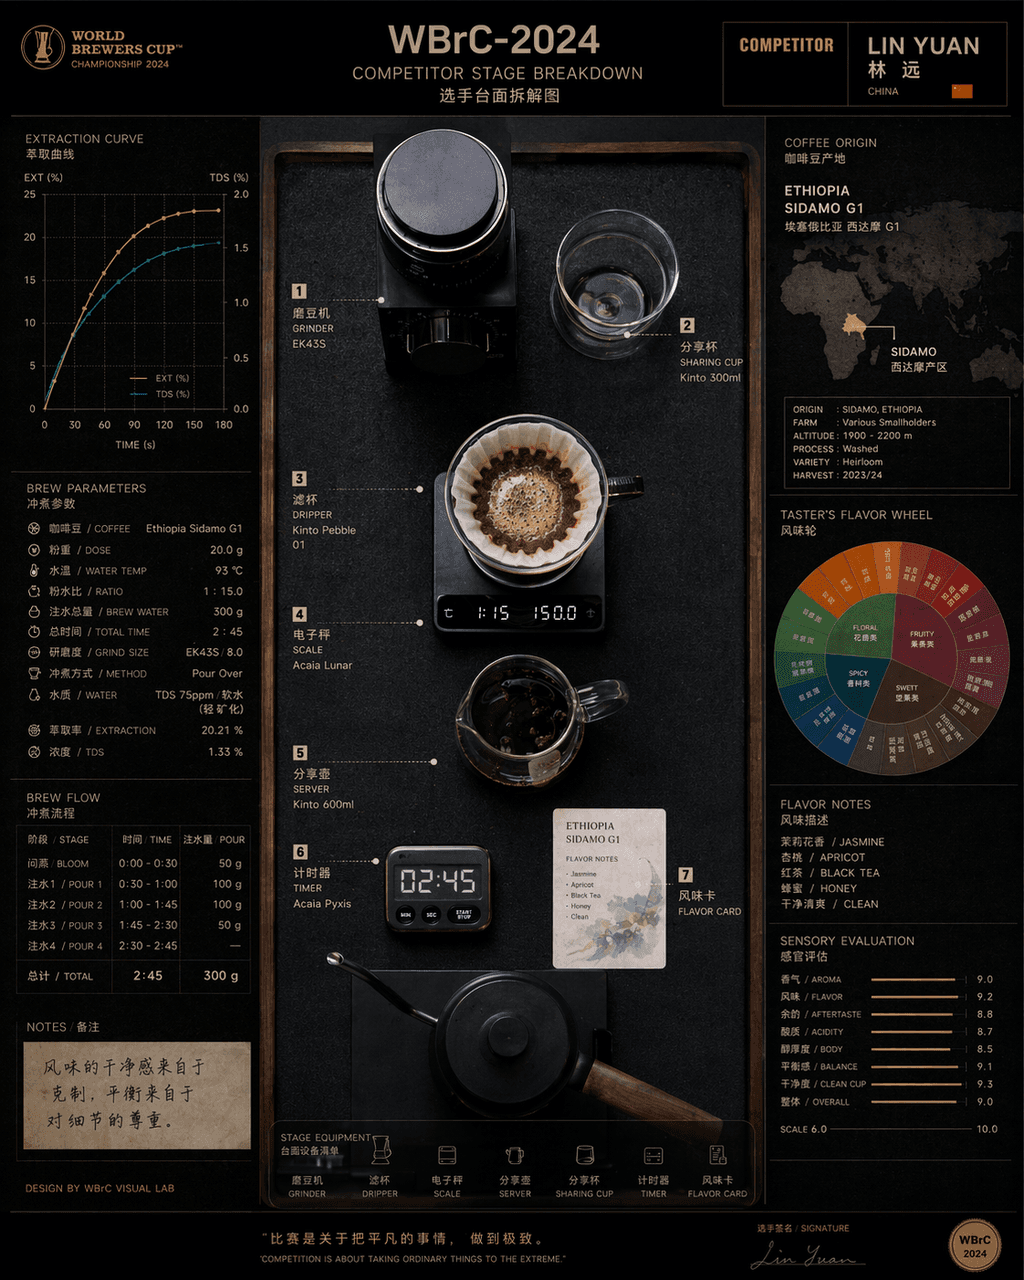
"Disassembly of countertops of contestants at the Hand-brew Coffee World Championship" combines product process photography with competitive sports visuals. In the center is an overhead shot of the competition platform, with grinders, filter cups, electronic scales, sharing pots, timers, and flavor cards accurately positioned. On the left are the extraction curves and brewing parameters, and on the right are bean source maps and flavor wheels. The title on the top has event numbers and player names. The overall look is like a fusion of a high-end food industry atlas and a sports event visual system, with a ratio of 4:5.

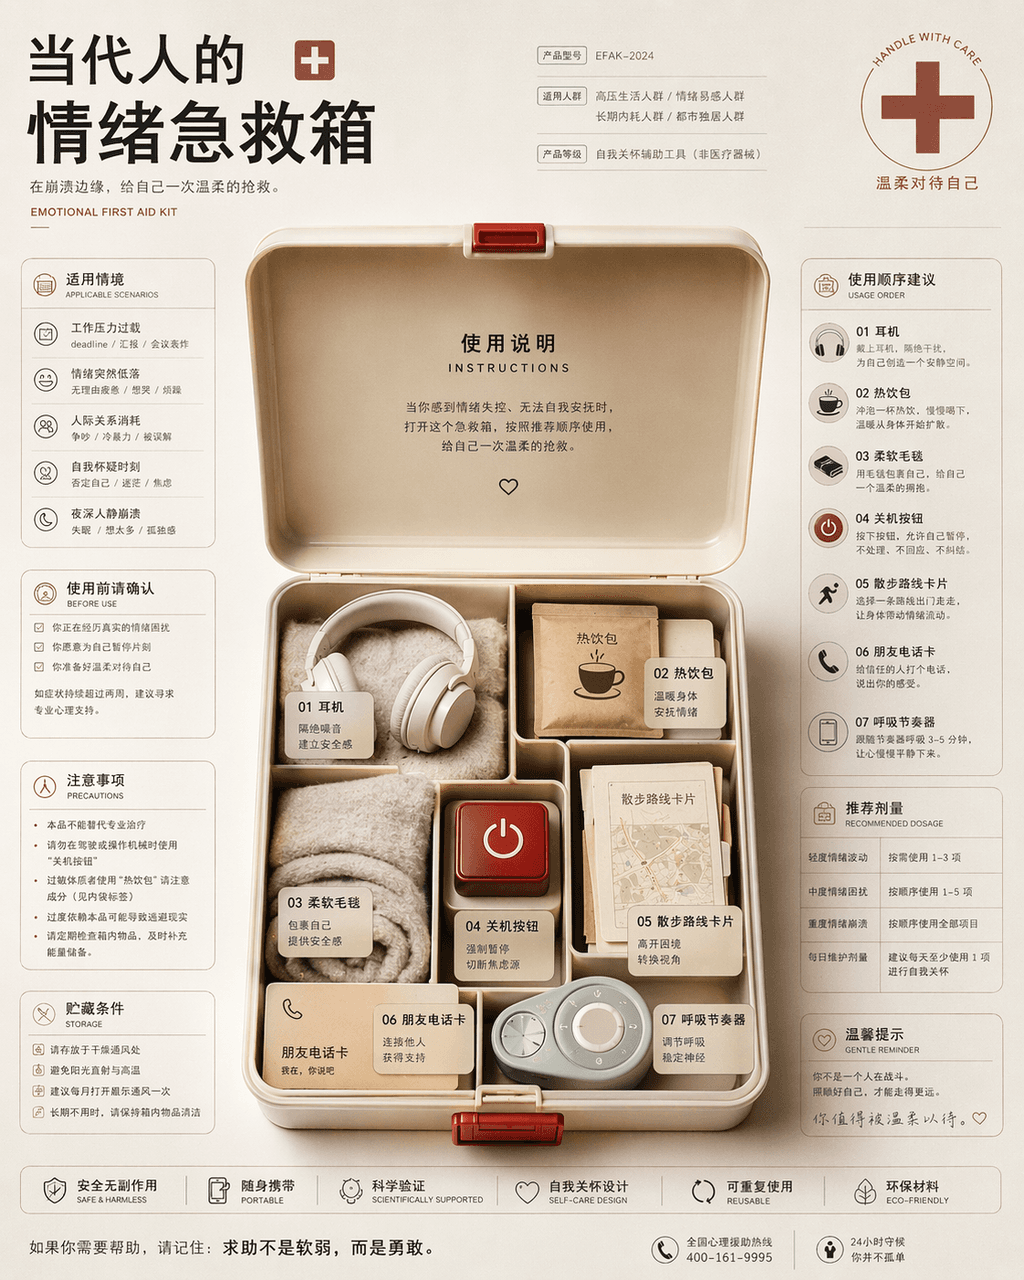
Emotional first aid kit for contemporary people

Emotional first aid kit for contemporary people

"Contemporary People's Emotional First Aid Kit Instruction Page", the packaging design is integrated with health information graphics. In the center of the picture is an open first aid kit, which is not medicine but headphones, hot drink packs, soft blankets, power off buttons, walking route cards, friend phone cards, and breathing pacemakers. The left and right sides are typed like drug instructions, with detailed descriptions of applicable situations, order of use, precautions and recommended dosages. The style is rational and restrained but the bottom layer is very gentle, with a ratio of 4:5.

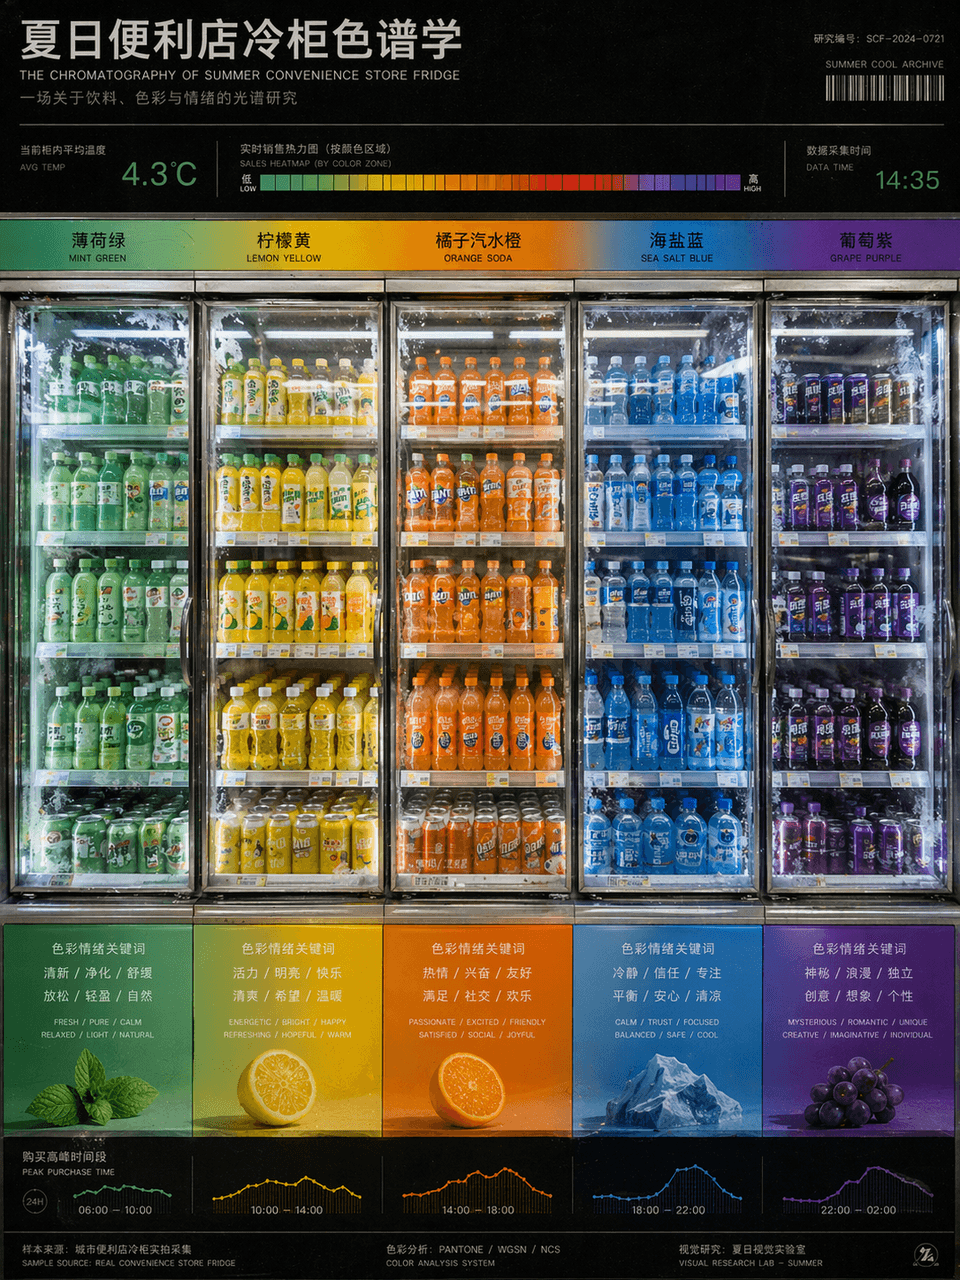
Summer convenience store freezer chromatography

Summer convenience store freezer chromatography

"Summer Convenience Store Refrigerator Chromatography" is a fusion of product photography and color research charts. The refrigerators are arranged from left to right according to the gradient of beverage packaging colors, from mint green to lemon yellow, orange soda orange, sea salt blue, and grape purple. There are temperature readings and sales heat bars on the top, and the bottom corresponds to the emotional keywords and purchase time periods brought by each color. The picture looks like a design school color course poster, but the content comes from a real convenience store scene. The frosting details of the glass door and the reflection of fluorescent lights are very realistic, with a ratio of 3:4.

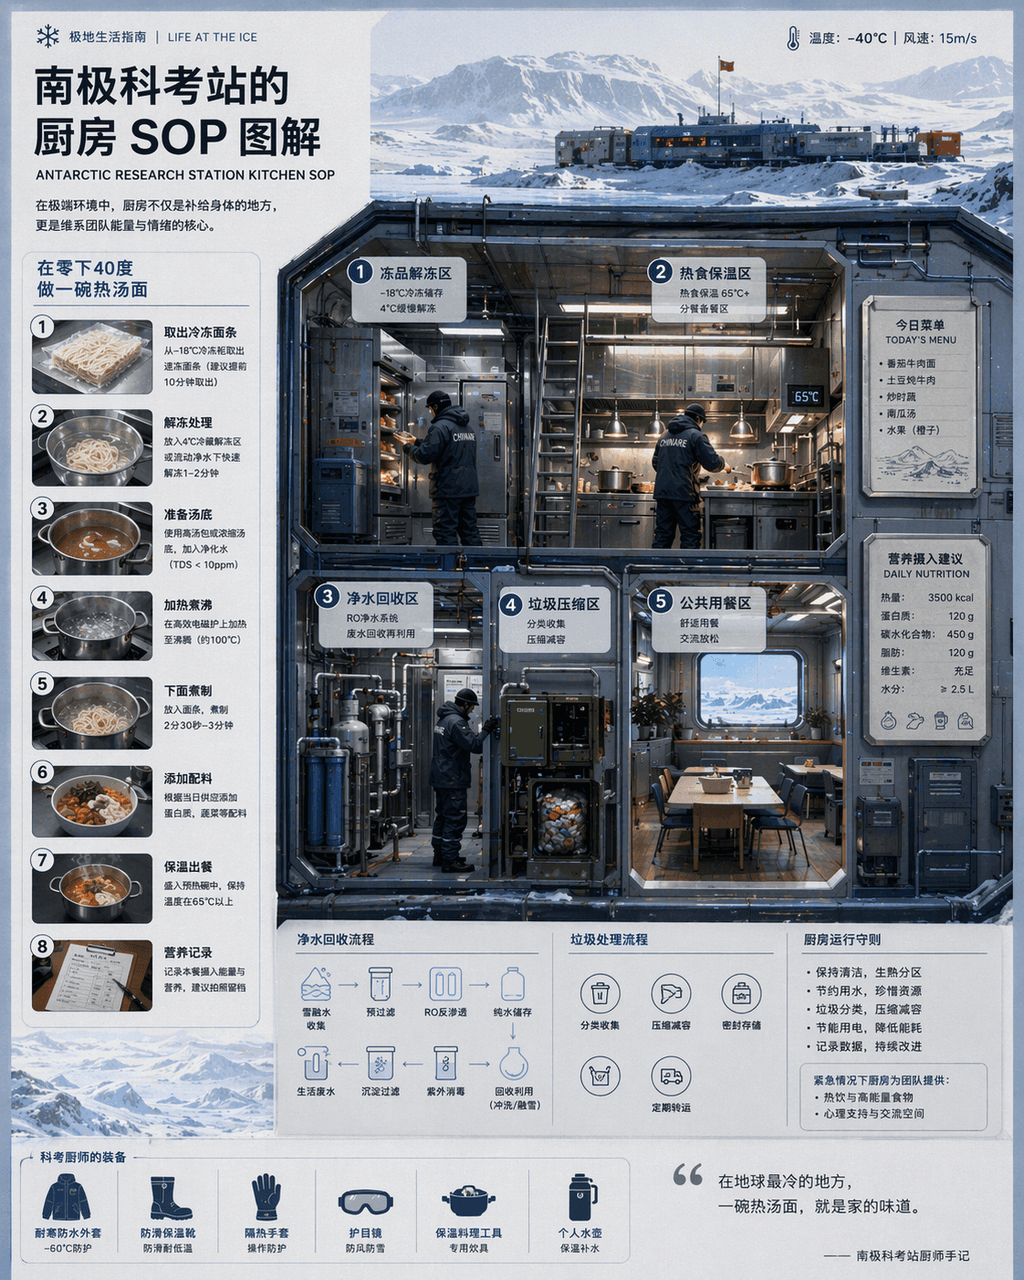
Antarctic Station Kitchen Infographic

Antarctic Station Kitchen Infographic

“Kitchen SOP at Antarctic Research Station "Illustration" combines scientific illustrations with catering flow charts. The main screen is a cross-section of a cold-resistant kitchen, with partitions indicating thawing of frozen products, hot food insulation, purified water recycling, garbage compression, and public dining areas. The chef wears a heavy scientific examination uniform. There is a magnetically attached today's menu and nutritional intake recommendations on the wall. A numbered step-by-step diagram on the left explains "making a bowl of hot noodle soup at minus 40 degrees." The visual style is clean and professional, and the information density is high, like a National Geographic special issue insert, with a ratio of 4:5.

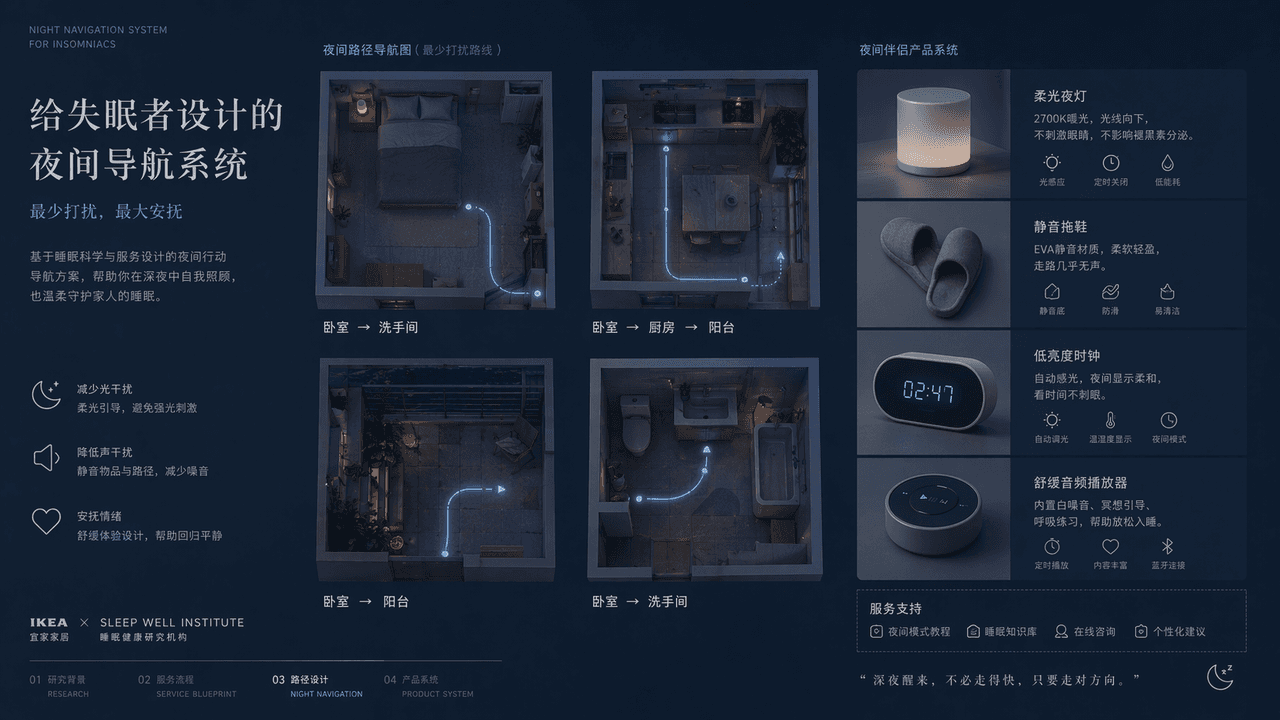
Night Navigation Service Design

Night Navigation Service Design

"A night navigation system designed for insomniacs", the service design plan display page, the main screen is an overhead view of the four night paths of the bedroom, kitchen, balcony, and bathroom, with extremely thin luminous lines marking the route that least disturbs the family. Next to it is the design of supporting objects such as soft night lights, silent slippers, low-brightness clocks, soothing audio players, etc. The title is restrained and gentle, and the color is indigo, gray blue, and milk white. The overall picture is like a joint proposal from IKEA + a medical sleep research institution, with both functional rationality and emotional comfort. The proportions 16:9.

Emoji History Museum Exhibit

Emoji History Museum Exhibit

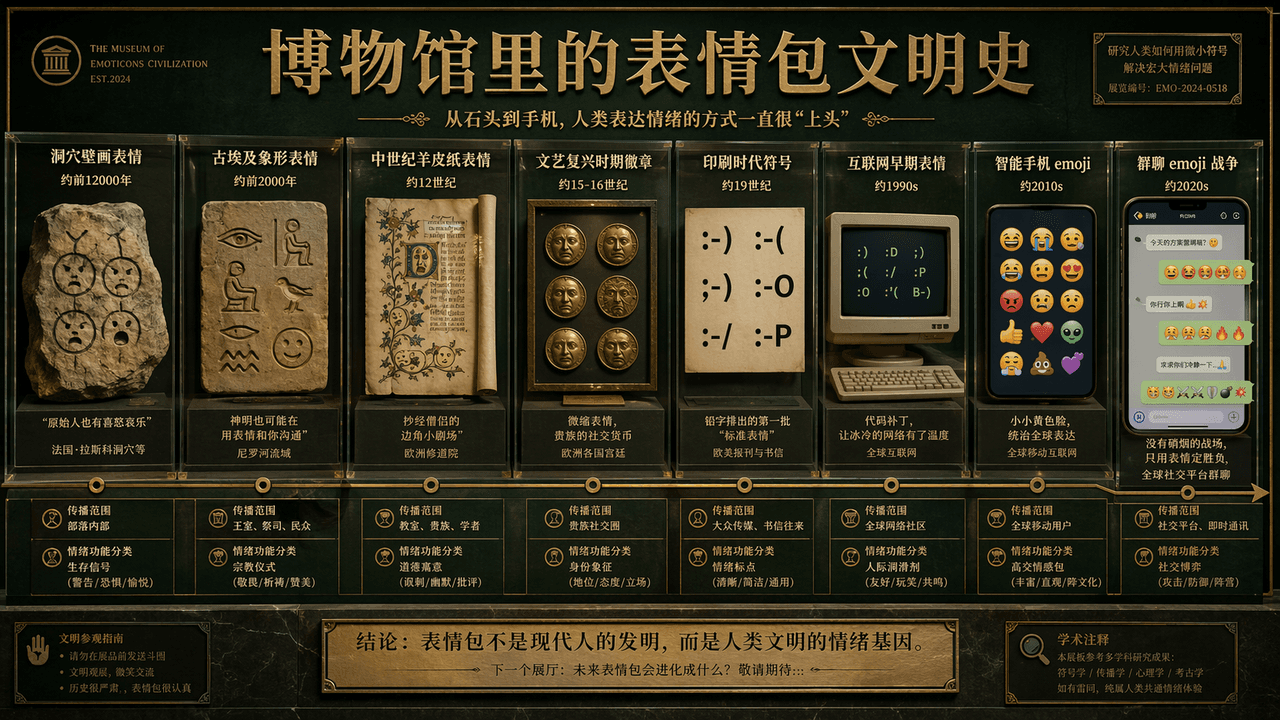
"The History of Emoji Civilization in the Museum" is a humorous fusion of academic display boards and Internet subculture. The main screen is like the wall of the exhibition hall of the Natural History Museum. The timeline extends from "cave painting emoticons" to "group chat emojis". War", representative emoticons of each era are displayed in the form of showcases, slates, parchments, computer screens, and mobile phone bubbles, with brief academic notes, age, scope of dissemination, and "classification of emotional functions." The title is serious, and the subtitle is slightly humorous. The color scheme uses museum dark green, warm white, and copper gold. The picture is both solemn and absurd, with a ratio of 16:9.

Four-Season Seaside Storefront Guide

Four-Season Seaside Storefront Guide

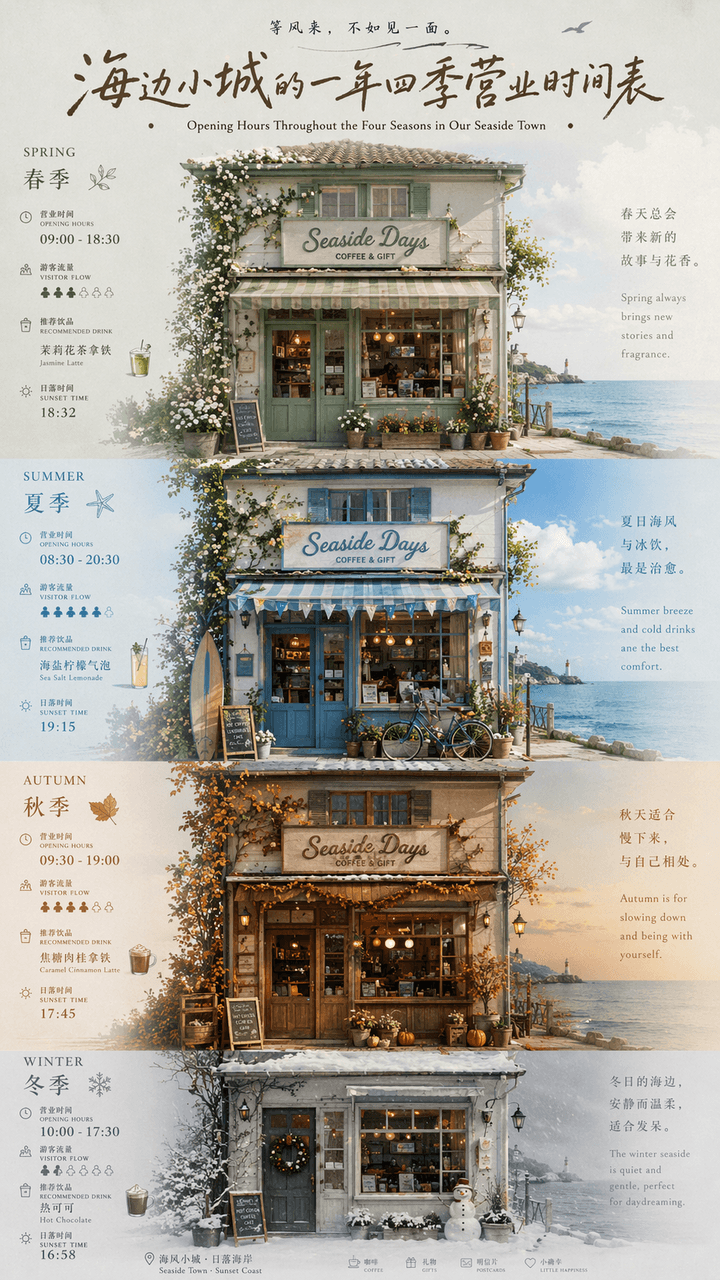
"A year-round business schedule of a small seaside town" is a fusion of local cultural and tourism posters and calendar infographics. The picture is centered on the facade of a seaside store. The four seasons of spring, summer, autumn and winter are represented by changes in window furnishings, door plants, sky colors and clothing. Each season is next to a thin number. The business hours, tourist flow, recommended drinks, and sunset time are marked. The title uses retro handwritten signature characters, and the subtitles are arranged in Chinese and English. The whole thing looks like an independent magazine travel feature. The color scheme transitions from sage green in spring, sea salt blue in summer, caramel brown in autumn to foggy gray white in winter. The proportions 9:16.

Emotional Transit Map Poster

Emotional Transit Map Poster

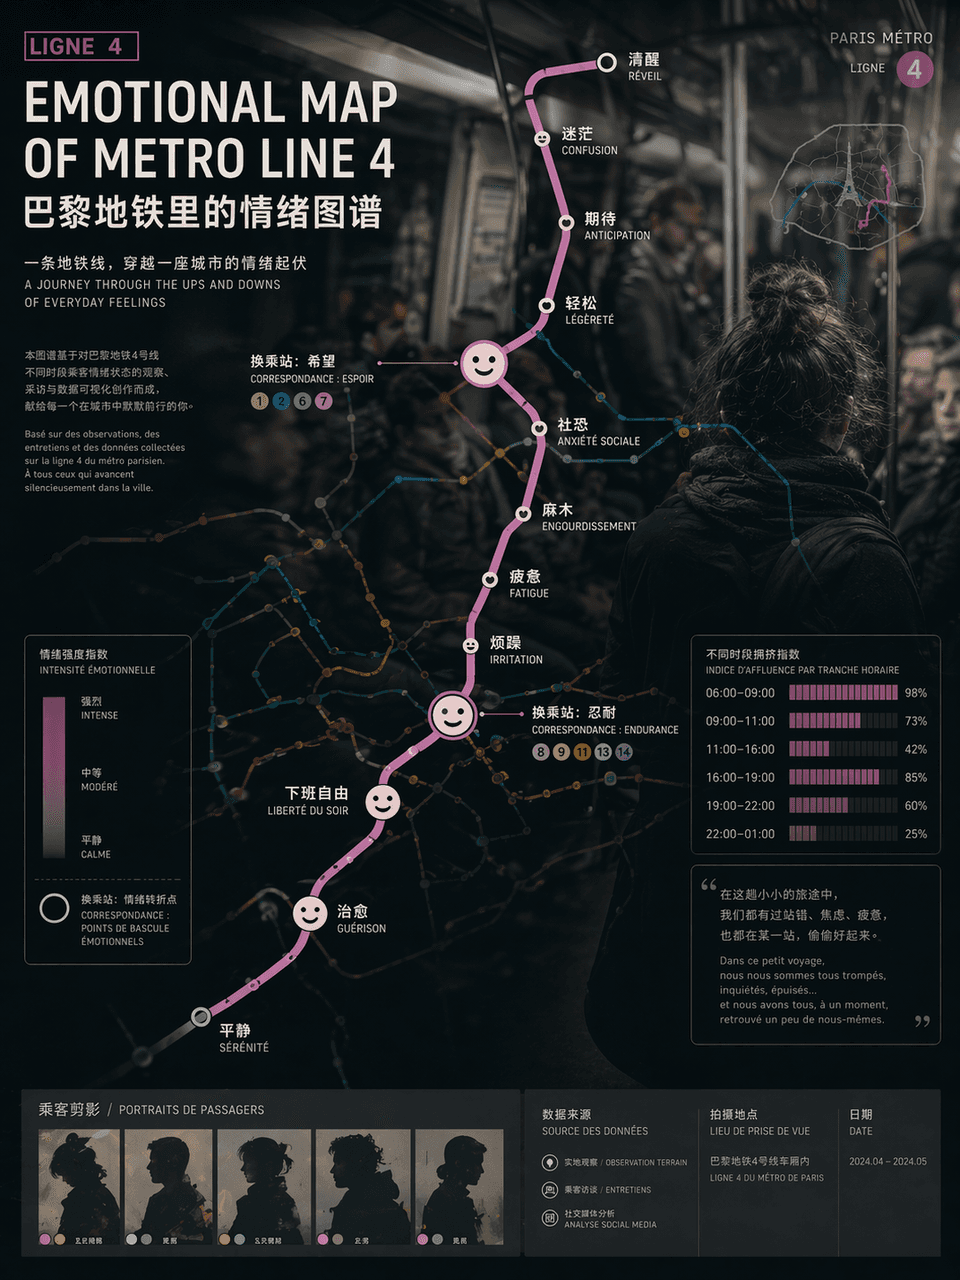
"EMOTIONAL MAP OF METRO LINE"/"EMOTIONAL MAP OF METRO LINE" 4", the emotional visualization poster is integrated with the urban traffic map. The route map uses standard subway map syntax, but the station name of each station is replaced with an emotional state, such as "awake", "numb", "expectation", "social fear" and "free from get off work", and the transfer nodes are enlarged into abstract expression icons , the background is vaguely blurred out in the style of documentary photography of crowded carriages. Passenger silhouettes and crowding index bar charts at different time periods are embedded in the corners of the poster. The title uses calm Swiss-style sans serifs. The subtitle is like an introduction to an art exhibition. The overall design combines social observation and contemporary art temperament. The proportions 3:4.

Vintage Writer Desk Infographic

Vintage Writer Desk Infographic

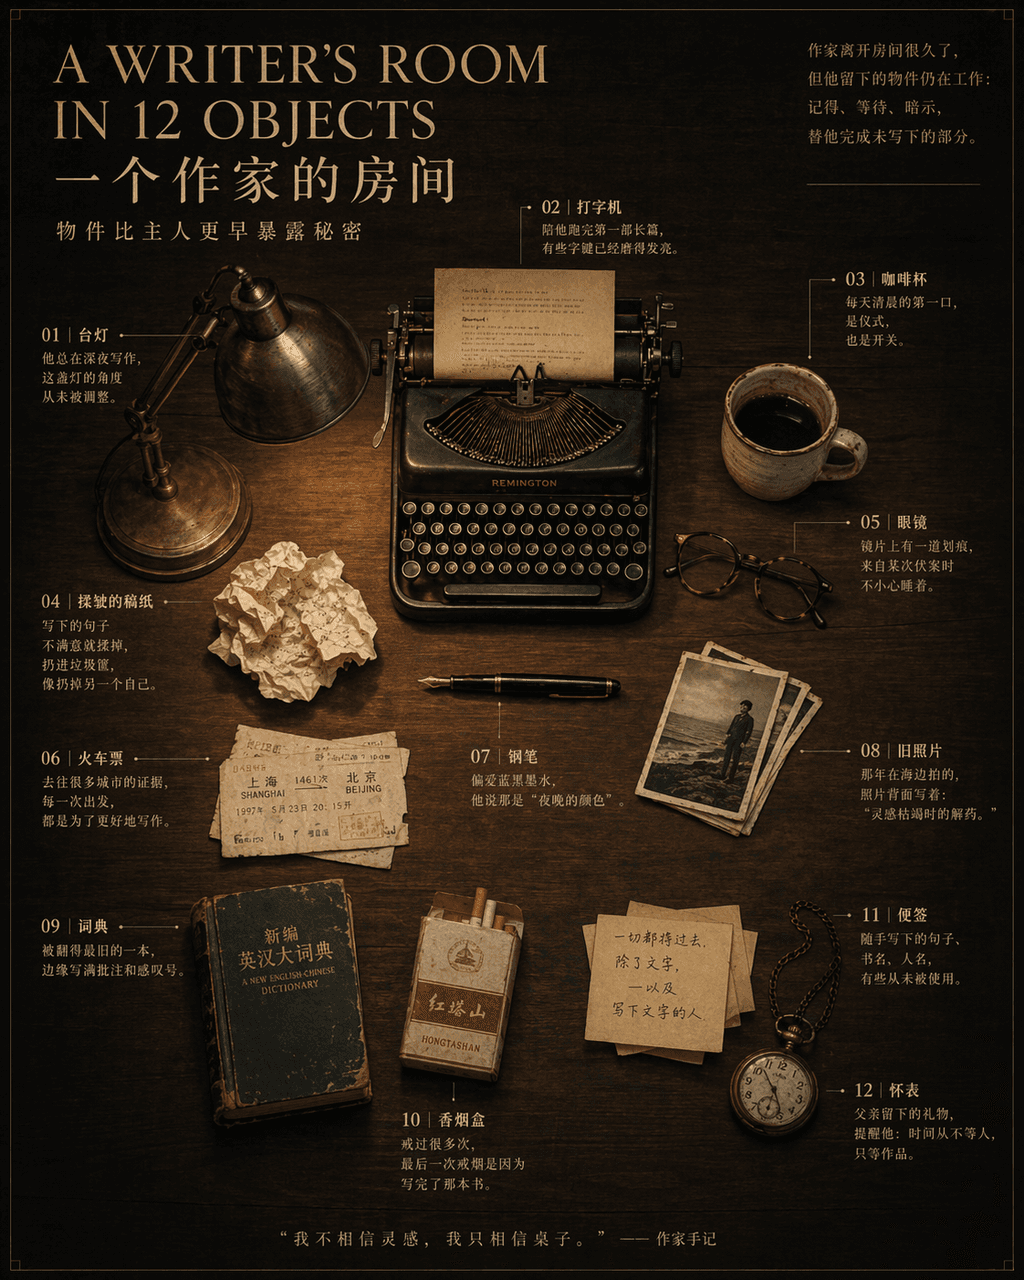
“A WRITER’S ROOM IN 12 OBJECTS”, a magazine inside-page still life narrative poster, in the center is an overhead shot of a dark wood desk with 12 OBJECTS Objects are precisely placed: pens, typewriters, glasses, coffee cups, crumpled manuscript paper, train tickets, desk lamps, old photos, dictionaries, cigarette boxes, sticky notes, pocket watches. Notes are drawn with thin lines next to each item, marking a short story related to the owner. The title uses an elegant serif font, and the subtitle reads "Objects reveal secrets earlier than their owners." 4:5.