New: GPT Image 2.5 Flare and Sunburst. Try them free with 3 images on sign-up, then 8 credits each.
Try GPT Image 2.5

Seedream 4.5 Prompts & Prompt Writing Guide

4,545 templates · updated Oct 2026

Seedream 4.5 is ByteDance's image model for posters, product shots and illustrations with short on-image text. On GPT Image Hub it renders at 2K or 4K for the same 33 credits, with up to 10 reference images.

Start with the writing guide below, then pick one of the 4,545 library templates set up for Seedream 4.5 and the rest of the Seedream family (4.0, 5.0, 5.0 Pro and 5.0 Lite). Each template opens in the generator with its recommended Seedream version selected.

Showing 1–24 of 24 Seedream · Infographic / Education prompts

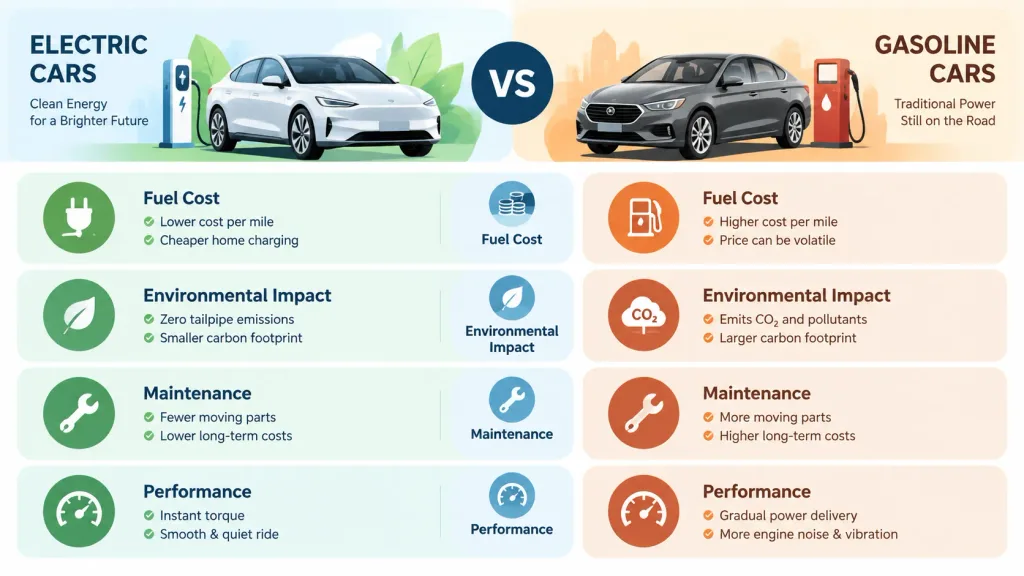
Electric vs Gas Cars Infographic

Electric vs Gas Cars Infographic

A visual comparison infographic chart comparing [electric cars] versus [gasoline cars]. Two-column layout with clean, modern graphic design, featuring minimalist icons and brief descriptive text comparing factors: [Fuel Cost], [Environmental Impact], [Maintenance], and [Performance]. Balanced composition, clear typography, intuitive visual hierarchy, professional vector presentation.

infographiccomparison chartelectric cars
Modern Web Application Architecture Diagram

Modern Web Application Architecture Diagram

A high-level system architecture diagram for [a modern web application], designed for a stakeholder presentation. Features clean minimalist icons representing key components: [user browser, load balancer, web servers, database cluster, and third-party APIs]. Clear directional arrows and connector lines illustrate data flow between components. Clean layout, professional corporate presentation aesthetic, crisp typography, well-spaced structure, light minimalist background.

system architecturecloud diagraminfographic
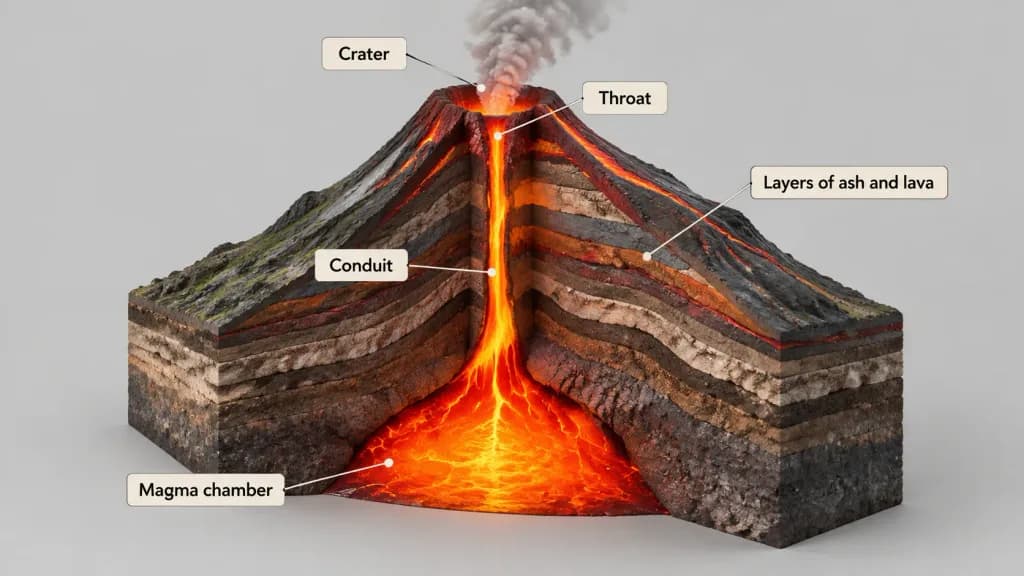
3D Cutaway Diagram of Volcano Structure

3D Cutaway Diagram of Volcano Structure

A 3D cutaway diagram of a [volcano], showing its internal geological structure in cross-section. The diagram clearly labels the [magma chamber], [conduit], [throat], [crater], and [layers of ash and lava]. Clean, technical educational illustration style with realistic textures for subterranean rock strata and glowing molten magma, presented against a neutral studio background.

volcanocutawayinfographic
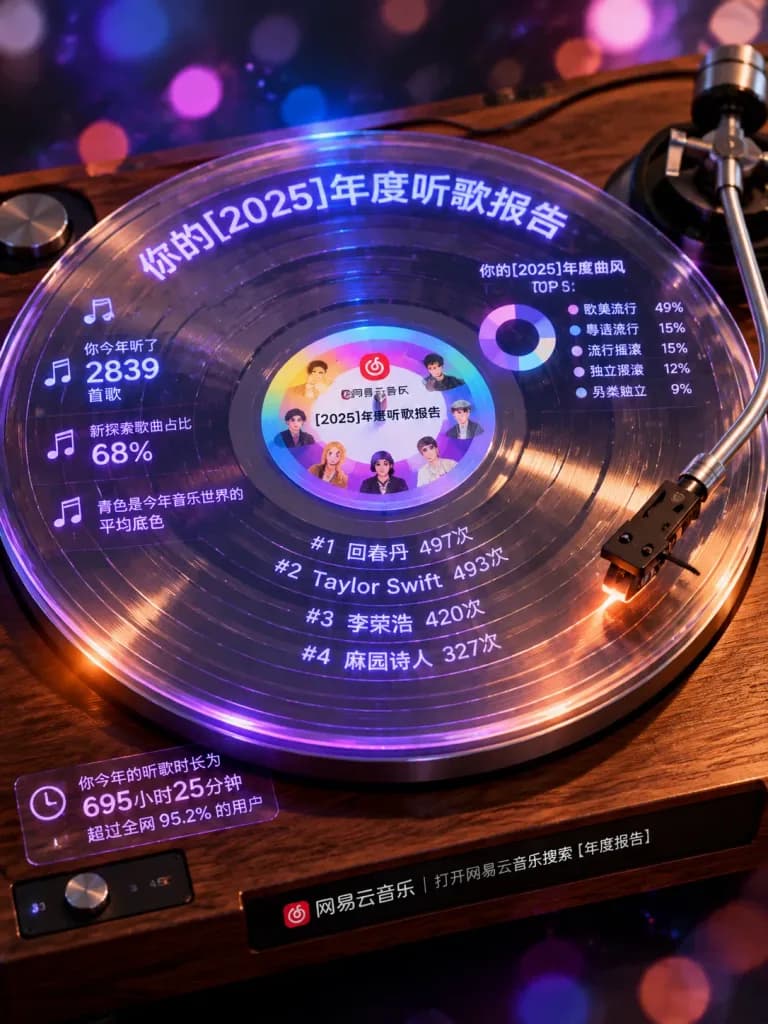
Music Annual Report Acrylic Vinyl Infographic

Music Annual Report Acrylic Vinyl Infographic

Hyper-realistic macro photography of a crystal-clear transparent acrylic vinyl record spinning on a vintage wooden and metal turntable, with subtle rotational motion blur. The tonearm gently rests on the record with the stylus tracing the grooves. The scene is shot from a 45-degree overhead perspective, set against a dark, dreamy night sky background dissolved into smooth purple, deep blue, and pink bokeh spheres (simulating f/1.4 shallow depth of field). The transparent record features finely engraved luminous typography and infographic data integrated along its grooves, illuminated by neon purple and orange edge glow: - Center Label: Circular label featuring the NetEase Cloud Music red logo and the text "[2025]年度听歌报告" surrounded by rainbow gradient accents and small illustrated artist avatar icons. - Top Rim: Bold modern Chinese title "你的[2025]年度听歌报告" glowing in a purple-blue neon gradient. - Center Grooves: Circular curved text ranking top artists: "#1 [回春丹] 497次", "#2 Taylor Swift 493次", "#3 李荣浩 420次", "#4 麻园诗人 327次". - Turntable Left Panel: Illustrated data with music note icons: "你今年听了 2839 首歌", "新探索歌曲占比 68%", "青色是今年音乐世界的平均底色". - Top Right Area: Radial genre breakdown chart: "你的[2025]年度曲风 TOP 5: 欧美流行 49%, 粤语流行 15%, 流行摇滚 15%, 独立摇滚 12%, 另类独立 9%". - Turntable Base Panel: Listening duration stats: "你今年的听歌时长为 695小时25分钟", "超过全网 95.2% 的用户". - Front Bevel: Sleek dark horizontal strip with the NetEase Cloud Music red logo and "网易云音乐 | 打开网易云音乐搜索【年度报告】". Warm directional sidelight and spotlight create crisp reflections, realistic refraction, and luminous edge highlights across the spinning acrylic surface and metallic turntable elements.

music reportvinyl recordinfographic
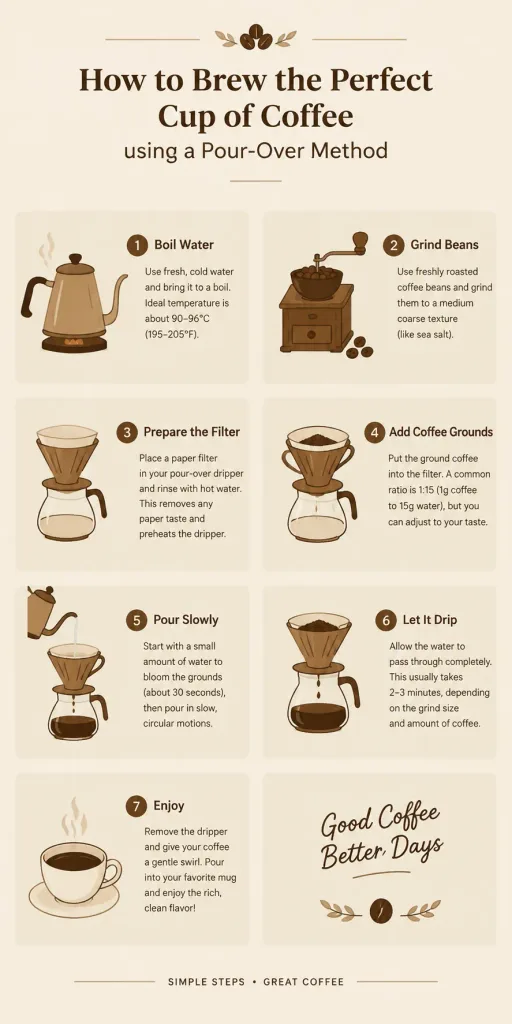
Pour-Over Coffee Brewing Infographic

Pour-Over Coffee Brewing Infographic

A minimalist, step-by-step visual infographic guide titled "[How to Brew the Perfect Cup of Coffee using a Pour-Over Method]". The vertical layout displays [6 to 8] sequential steps, each pairing a clean modern line icon with concise text instructions such as "[1. Boil Water]" and "[2. Grind Beans]". Flat icon design style, warm coffee-toned color palette with cream, beige, and rich brown hues, elegant typography, clear spacing, organized layout suitable for a specialty cafe or lifestyle blog.

infographicpour-over coffeecoffee brewing
FDM 3D Printer Explanatory Diagram

FDM 3D Printer Explanatory Diagram

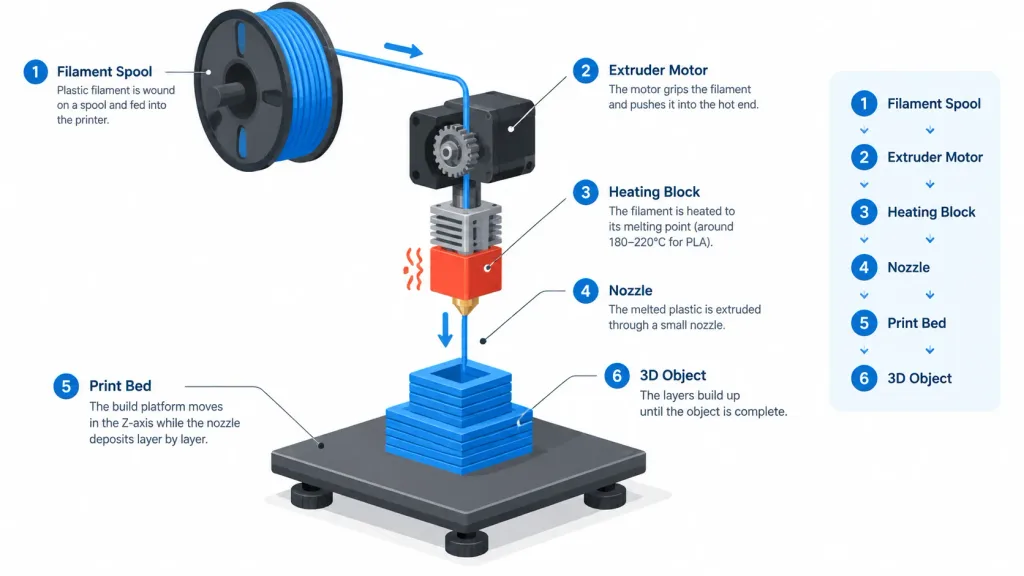
A clear, simple explanatory diagram illustrating how an [FDM 3D printer] works. The illustration shows [filament spool feeding material into the extruder motor], passing through the [heating block element], and the [nozzle depositing melted plastic layer by layer onto a print bed to construct a 3D object]. Isometric 3D vector illustration style, clean white background, clear directional arrows showing process flow, minimalist color palette, modern educational infographic aesthetic.

3d printerfdminfographic
Vintage Chalkboard Heart Anatomy Illustration

Vintage Chalkboard Heart Anatomy Illustration

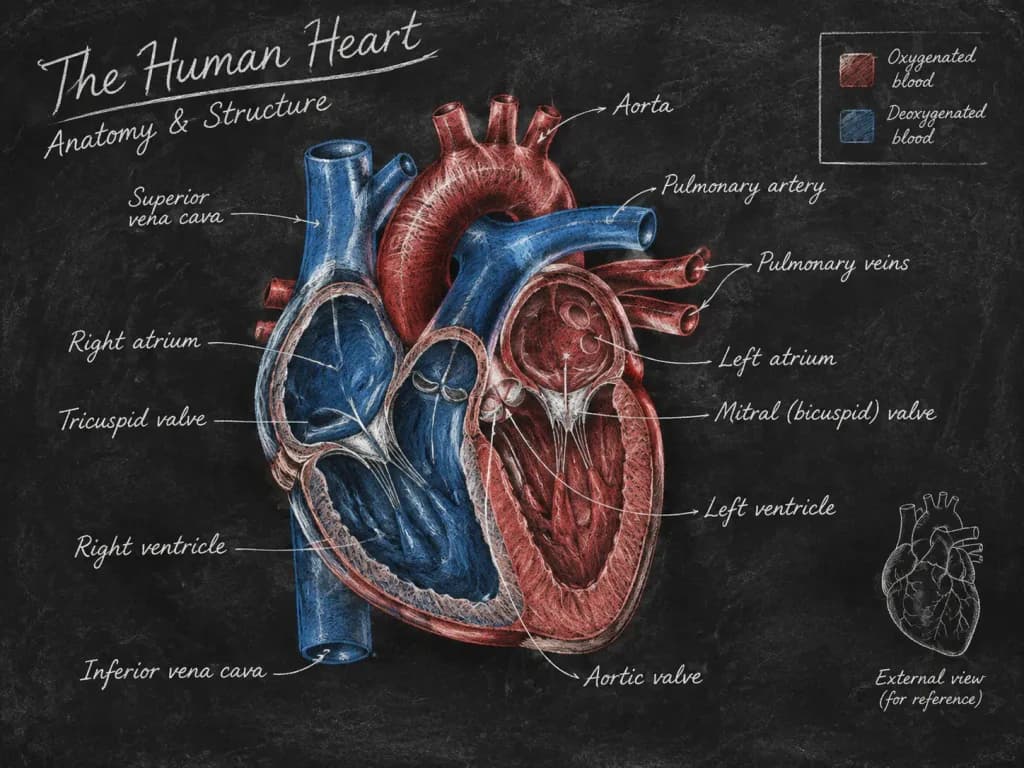
A detailed, vintage-style chalkboard illustration explaining the anatomy of [the human heart]. Realistic, scientific diagram drawn with white and colored chalk on a textured dark slate blackboard. Anatomical parts including ventricles, atria, and valves are labeled with elegant cursive handwriting, featuring fine chalk dust and authentic smudge textures.

chalkboardanatomyheart diagram
Scientific Plant Cell 3D Cross-Section

Scientific Plant Cell 3D Cross-Section

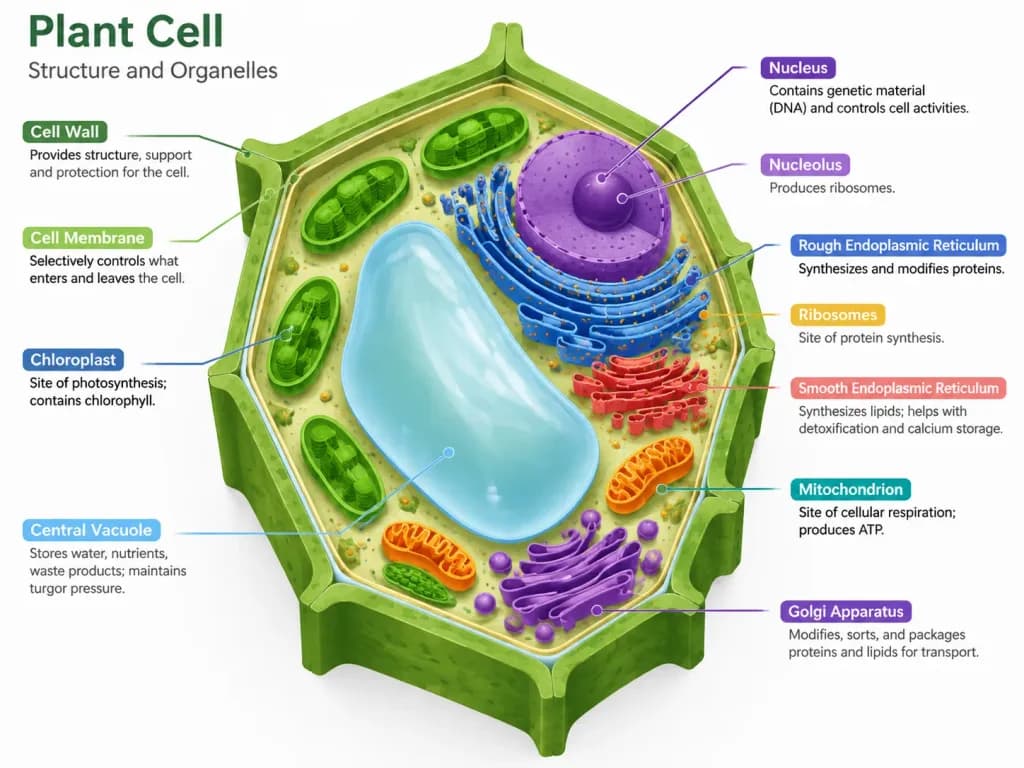
A detailed scientific 3D cross-section illustration of a [plant cell] in the style of a modern biology textbook diagram. Clearly visible internal structures including the [cell wall, cell membrane, nucleus, chloroplasts, and other organelles], each rendered with distinct, contrasting colors. Clean educational infographic style with clear visual callout labels, crisp studio lighting, neutral background.

plant cellbiologyscientific illustration
Doodle Recipe Knowledge Card

Doodle Recipe Knowledge Card

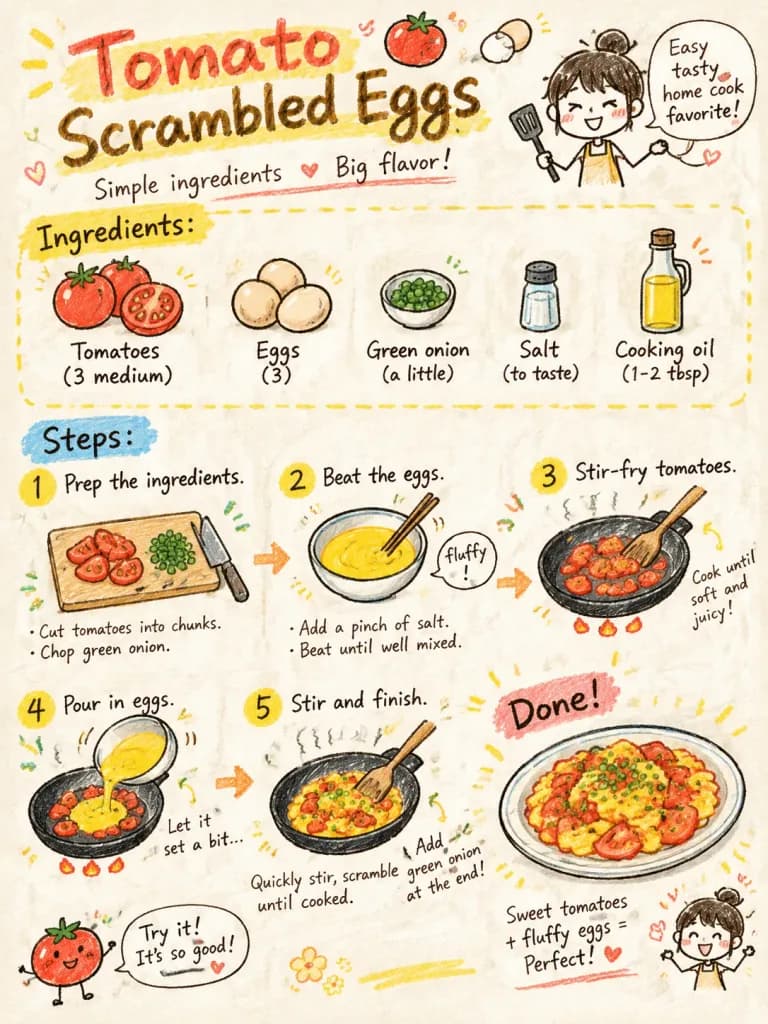
A hand-drawn doodle recipe note card for [Tomato Scrambled Eggs]. Style: casual hand-drawn visual note, journal sketchbook aesthetic. Typography: casual handwritten text annotations, playful lettering for the title, ingredients, and cooking steps. Elements: stick figures, cute ingredient doodles, hand-drawn arrows, speech bubbles, dashed dividers, and culinary icon illustrations. Color: lively and colorful with highlighter and colored pencil textures on a light paper background. Layout: spontaneous, organized scrapbook layout, energetic and easy to follow.

recipe carddoodle notehand drawn
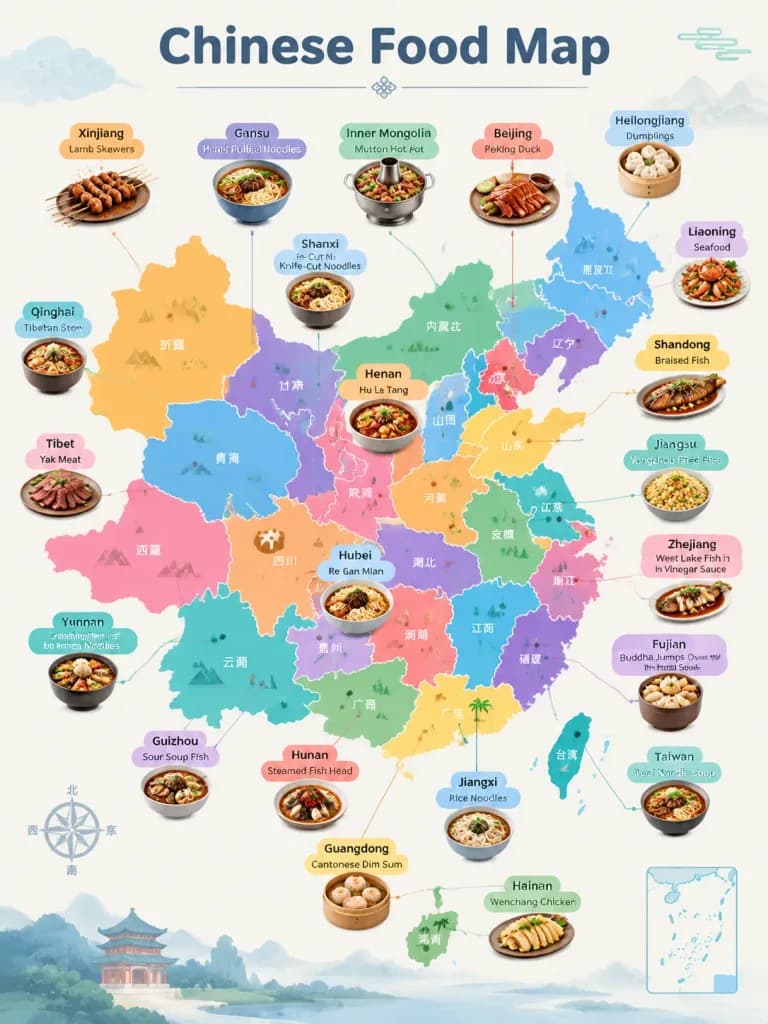
Chinese Food Map Infographic Poster

Chinese Food Map Infographic Poster

Graphic infographic poster titled "Chinese Food Map". The overall layout is based on the map of China, with each province depicted as a distinct colored flat vector block. Above representative provinces, clearly label the dish name and display a realistic three-dimensional miniature food icon with rich textures (such as [hot pot, roast duck, dim sum]). The main title "Chinese Food Map" is positioned at the top in neat, modern typography. Soft pastel color palette, hybrid visual style blending flat vector cartography with hyper-realistic 3D isometric food elements, clean and organized composition.

infographicchinese foodmap poster
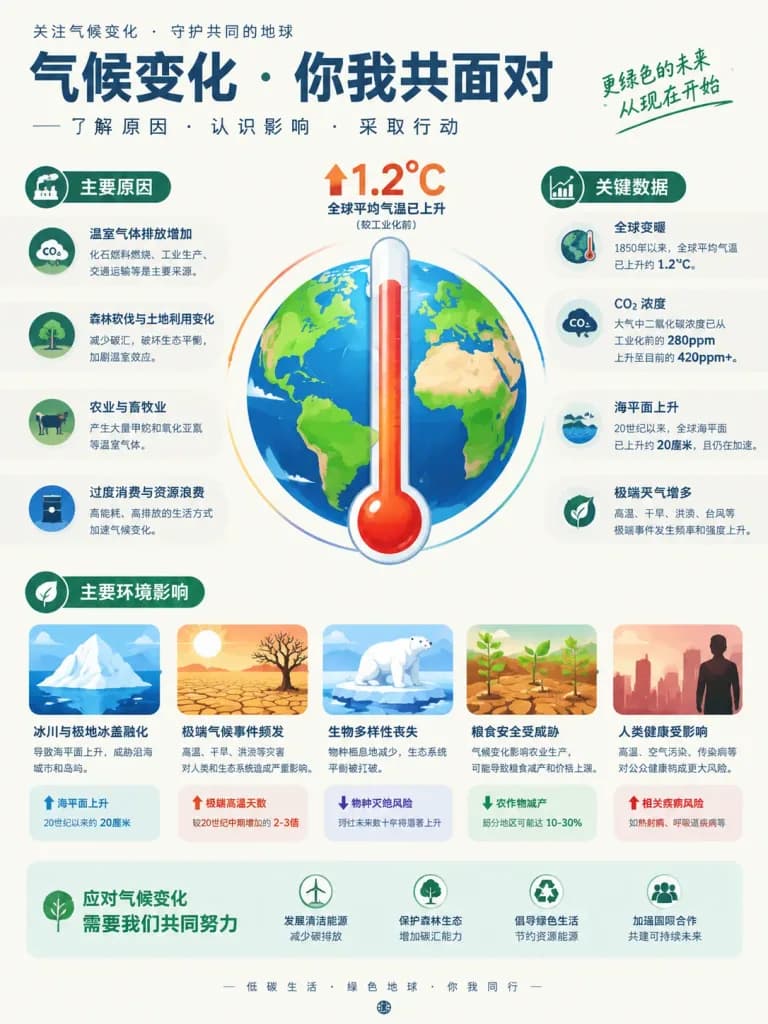
Climate Change Seminar Infographic Poster

Climate Change Seminar Infographic Poster

An informative mini-infographic poster for a public seminar on [climate change]. Central graphic features planet Earth embedded with a rising thermometer illustration, surrounded by neatly arranged modern icons, callouts, and data visualization points detailing causes and environmental impacts. Clean layout, flat vector style with subtle gradients, clear visual hierarchy, soft neutral background, professional educational design.

infographicposterclimate change
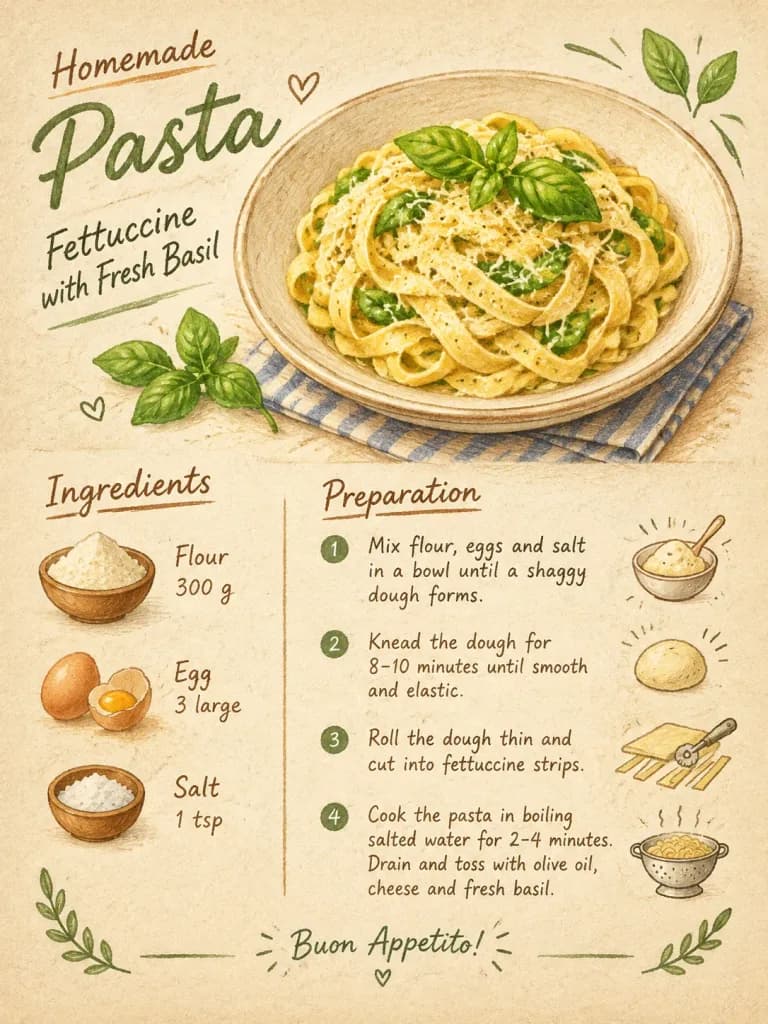
Rustic Illustrated Pasta Recipe Card

Rustic Illustrated Pasta Recipe Card

A beautifully illustrated recipe card for making [homemade pasta]. The top half features a charming illustration of the finished dish, [fettuccine with fresh basil]. The bottom half neatly displays the ingredients and preparation steps, accompanied by small hand-drawn icons for each ingredient ([flour, egg, salt]). The visual style is warm, cozy, and rustic, resembling a page from a handwritten family cookbook on textured paper.

recipe cardillustrationpasta
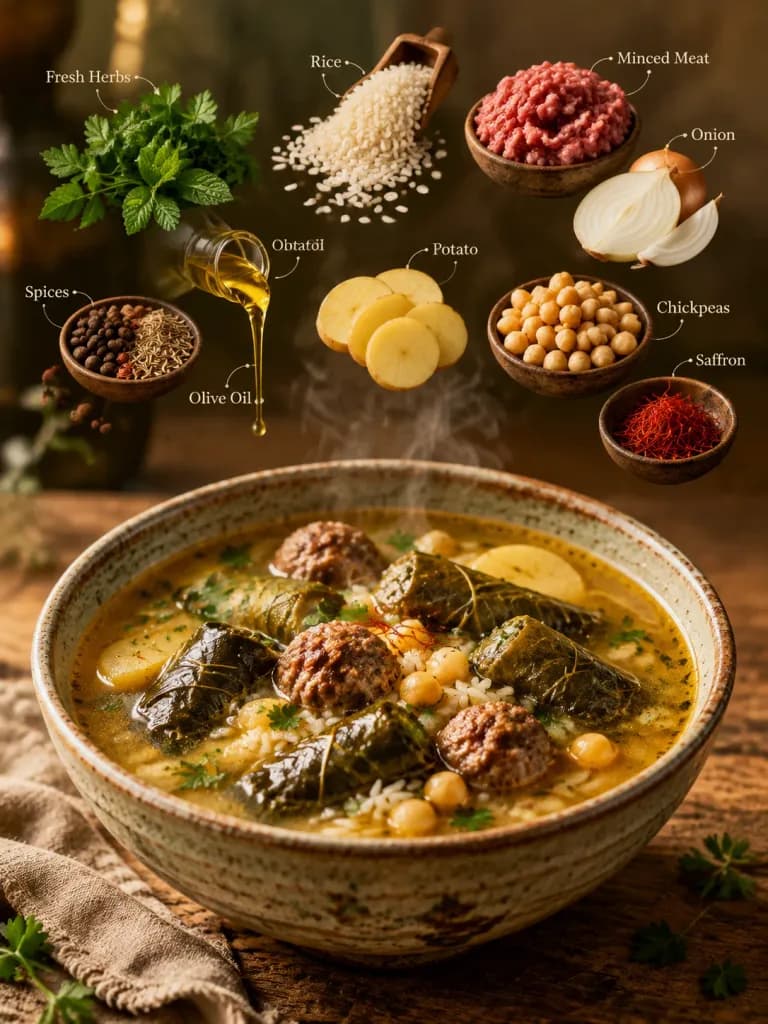
Floating Ingredients Culinary Infographic

Floating Ingredients Culinary Infographic

Cinematic editorial food photography of [grape-leaf rolls soup with meatballs] served in a bowl on a [rustic wooden table], with steam rising gently. Suspended above the finished dish, raw ingredients—[fresh herbs, rice, minced meat, onion, whole spices, a pour of olive oil, potato slices, chickpeas, and saffron strands]—float in a clean, organized levitating layout, each isolated and distinct. Subtle curved infographic lines and minimal text labels point to the ingredients. Warm studio lighting with soft shadows, shallow depth of field, earthy color palette, and premium culinary cookbook aesthetic with tactile food textures.

foodinfographicrecipe
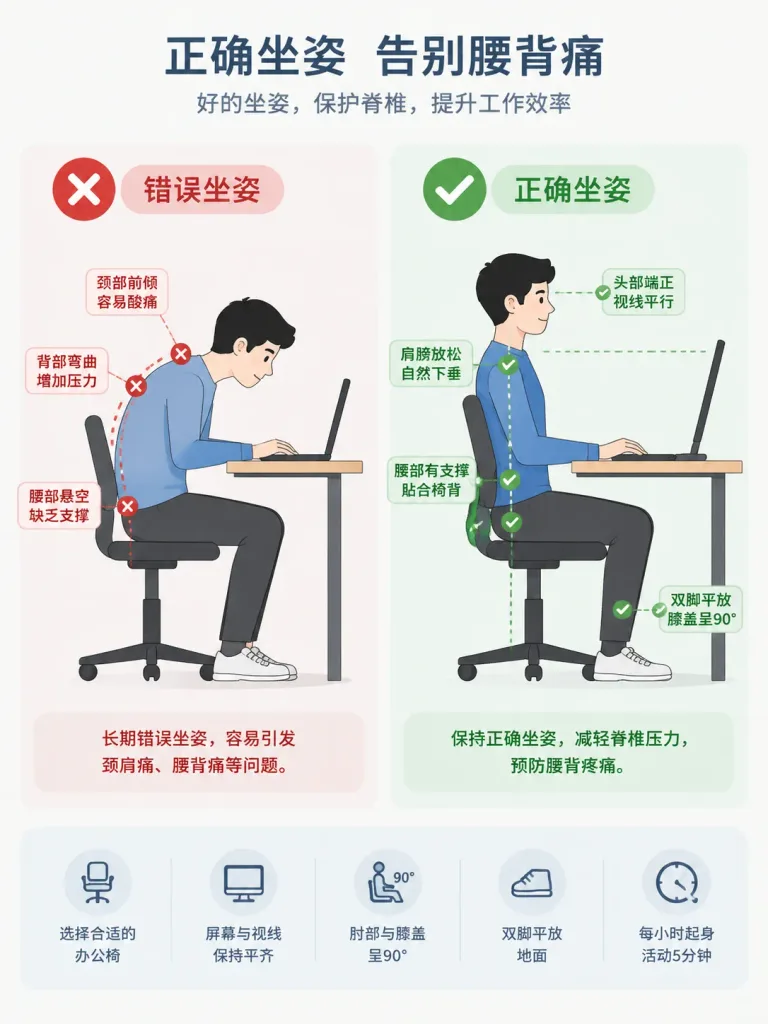
Ergonomic Desk Posture Infographic

Ergonomic Desk Posture Infographic

A workplace safety guide infographic illustrating correct desk sitting posture to prevent back pain. The layout features a side-by-side comparison of two figures seated at desks: one in an incorrect, slouched posture highlighted with red X marks at strain points, and the other in a proper, ergonomic posture highlighted with green checkmarks showing correct alignment. Minimalist corporate vector illustration style, clean lines, simple shapes, neutral light background, highly legible and universally understandable.

infographicergonomicsworkplace safety
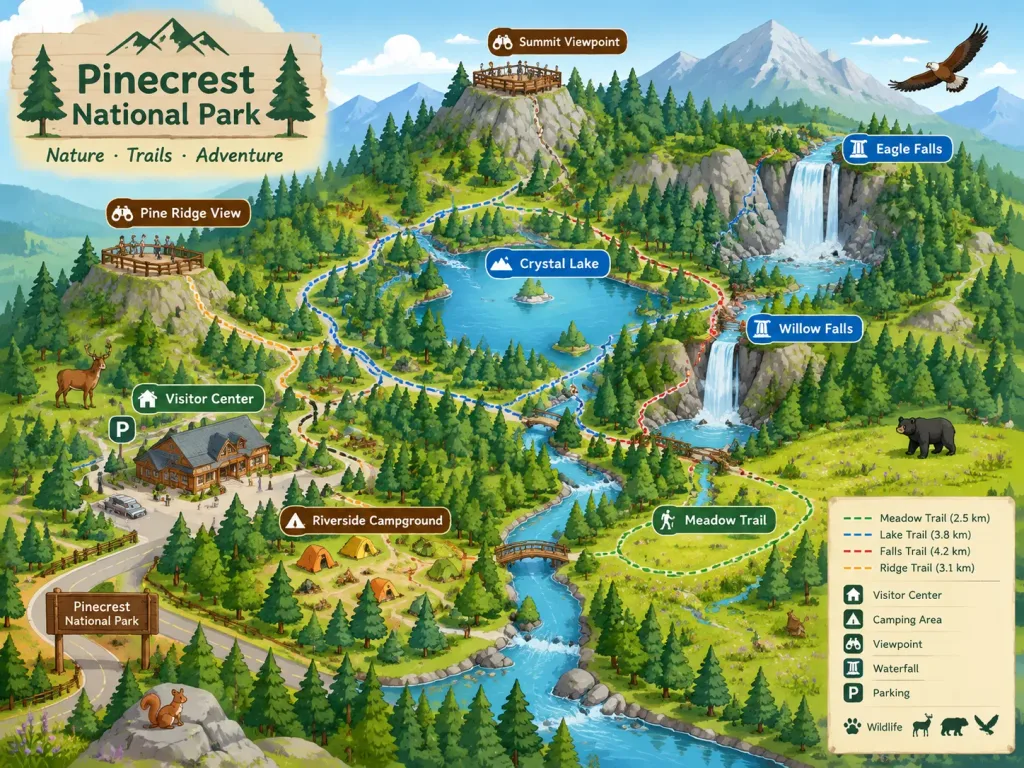
Isometric Illustrated National Park Map

Isometric Illustrated National Park Map

A stylized isometric illustrated map of [a national park], designed for a park brochure or website. The map highlights key hiking trails, prominent landmarks such as [waterfalls and scenic viewpoints], [visitor centers], and [camping areas]. Friendly and inviting illustration style featuring miniature local wildlife native to the park scattered across the terrain. Clear, readable composition balancing geographic layout with charming artistic details.

isometric mapnational parkillustrated map
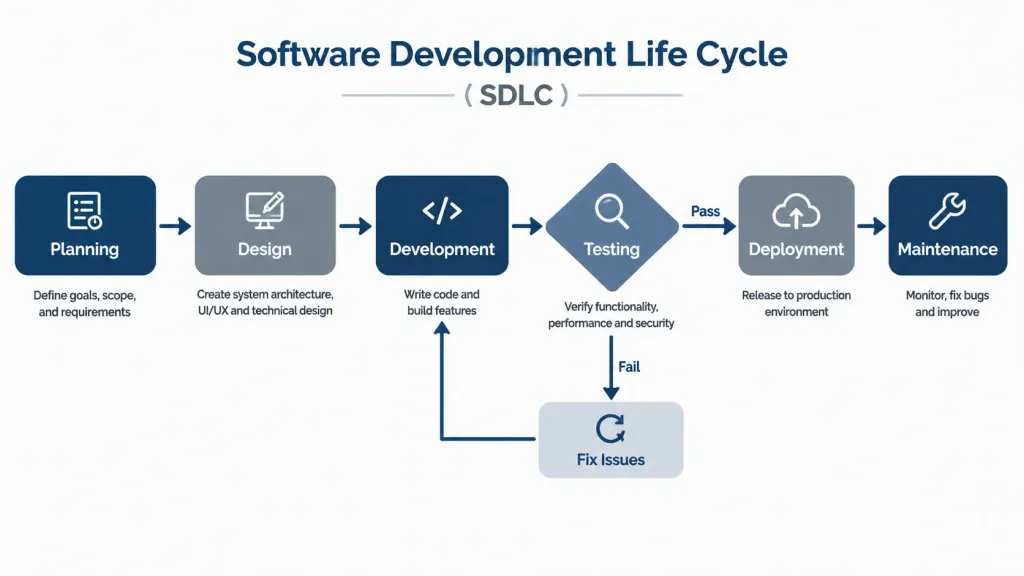
Corporate SDLC Process Flowchart

Corporate SDLC Process Flowchart

A clean and professional flowchart diagram illustrating the [Software Development Life Cycle (SDLC)]. The chart clearly details sequential stages: [Planning, Design, Development, Testing, Deployment, and Maintenance], represented by distinct geometric nodes including [rectangles and decision diamonds]. Connecting lines with sharp, directional arrowheads link each phase in an organized sequence. Corporate minimalist design, crisp vector graphic style, well-balanced infographic layout, flat aesthetic, clean background with a palette of [navy blues, muted grays, and white accents].

infographicflowchartsdlc
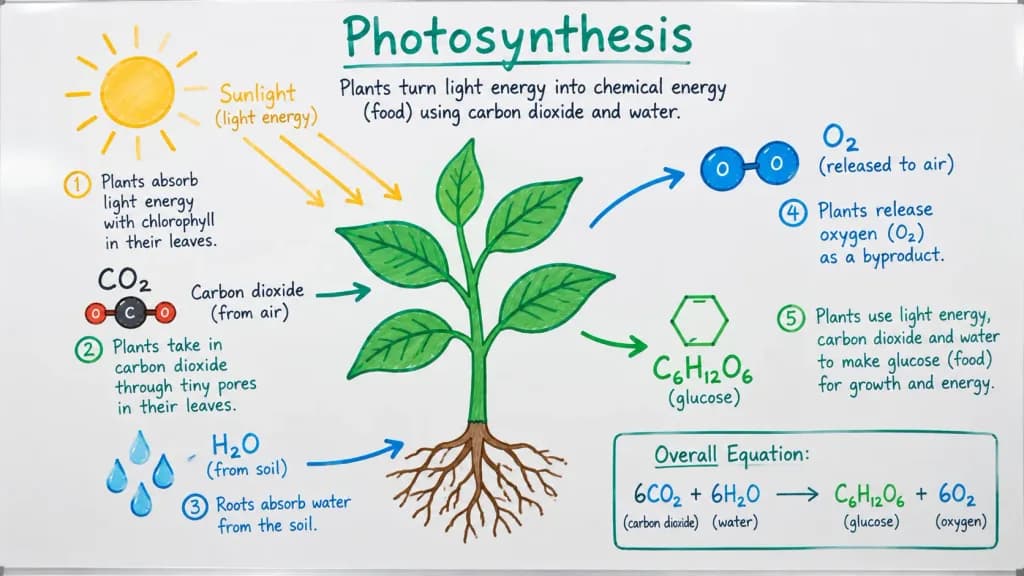
Classroom Whiteboard Photosynthesis Diagram

Classroom Whiteboard Photosynthesis Diagram

A detailed, hand-drawn whiteboard diagram illustrating [the process of photosynthesis], designed for [a high school biology class]. Sketched with dry-erase colored markers on a clean white board, featuring simple icons of [a sun, a green plant, water droplets, and CO2 and O2 molecules]. Includes neat handwritten annotations and clear directional arrows indicating the flow of energy and matter. Clean, legible instructional layout mimicking an authentic classroom whiteboard drawing.

whiteboardphotosynthesisinfographic
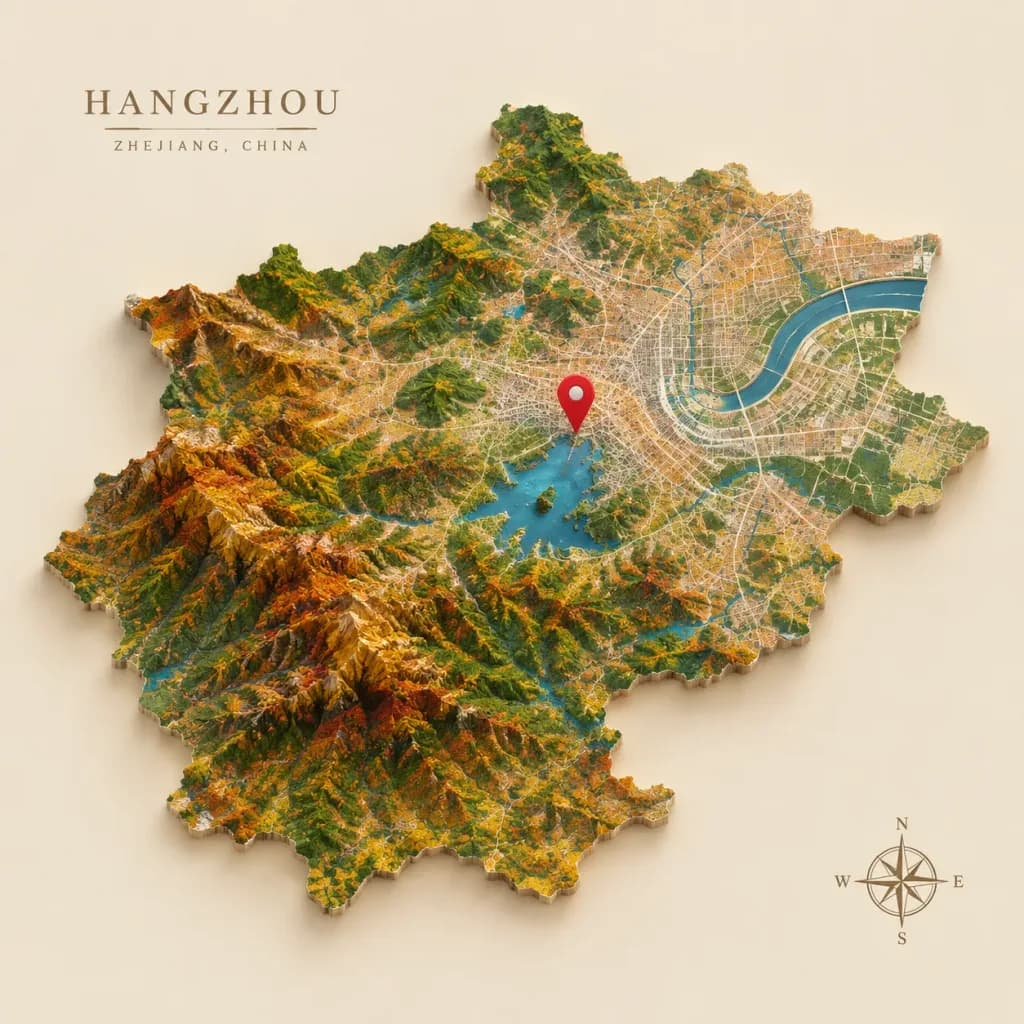
Autumn Topographical Map of Hangzhou

Autumn Topographical Map of Hangzhou

A realistic topographical relief map of [Hangzhou], with a [red location marker] centered. The terrain displays detailed urban regions and vegetated areas in warm autumnal tones, alongside crisp blue lake water set against a soft beige background. Delicate directional lighting casts soft shadows across intricate elevation contours.

topographic map3d reliefcartography
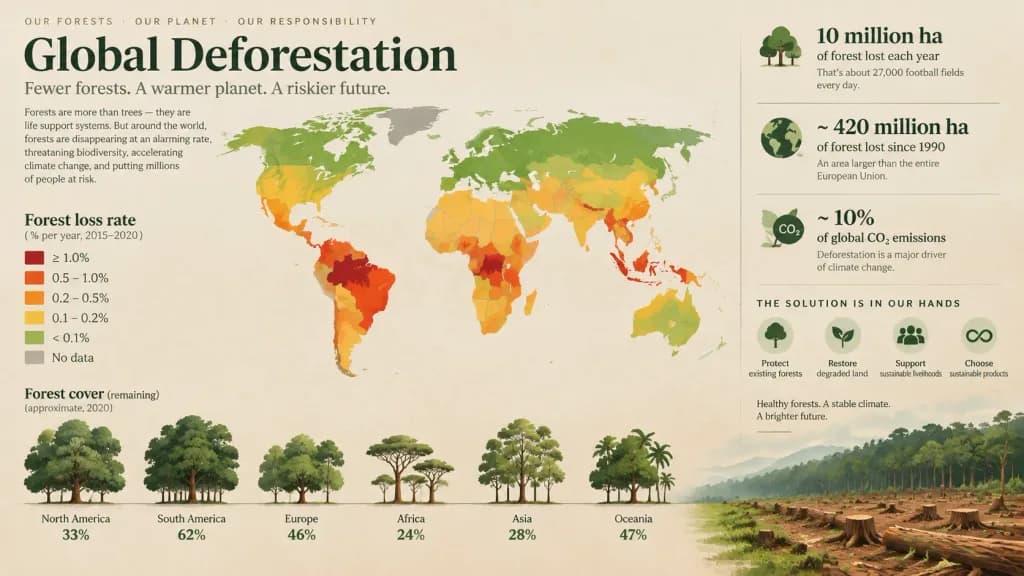
Global Deforestation Editorial Data Visualization

Global Deforestation Editorial Data Visualization

An informative, impactful editorial data visualization for a report on [global deforestation]. The central visual features [a stylized world map color-coded by rates of forest loss, accompanied by minimalist tree graphics where foliage density indicates remaining forest cover]. Clean graphic design layout, elegant typography, emotionally resonant storytelling, modern infographic aesthetic with a natural earth-tone palette contrasted with warning accent colors.

data-visualizationinfographiceditorial-design
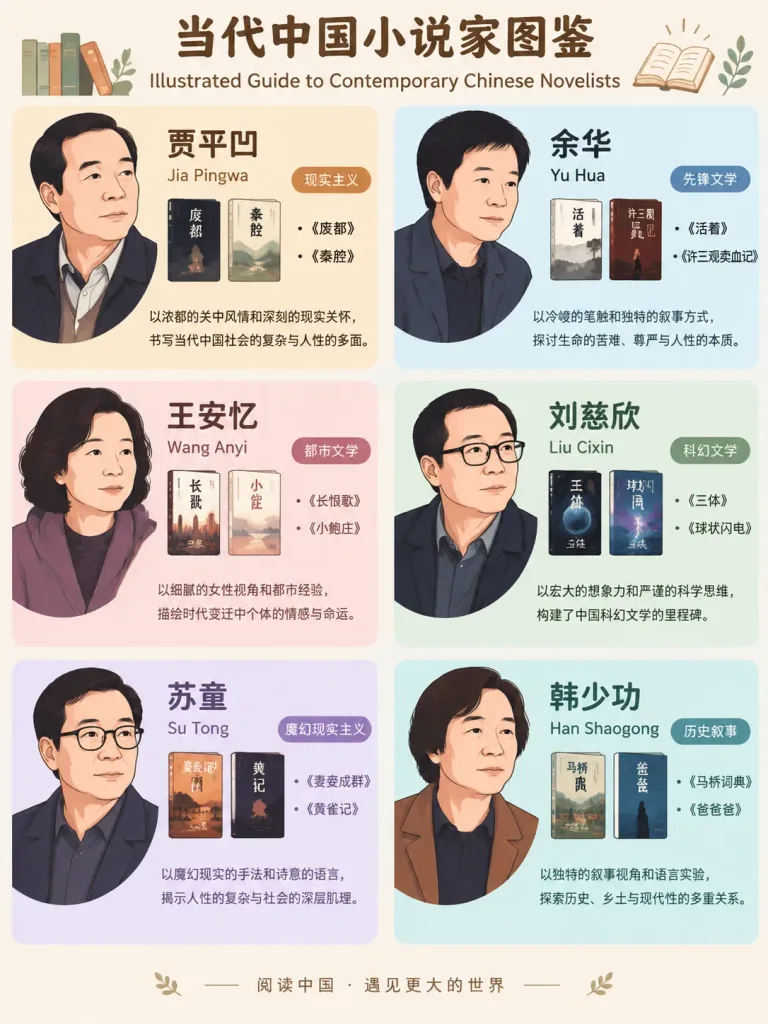
Contemporary Chinese Novelists Infographic Poster

Contemporary Chinese Novelists Infographic Poster

Graphic information poster titled "Illustrated Guide to Contemporary Chinese Novelists", designed in a clean flat illustration and infographic layout. The composition is divided into [6] grid sections on a light background with partitioned pastel color blocks. Each section showcases one representative contemporary Chinese novelist: [Jia Pingwa], [Yu Hua], [Wang Anyi], [Liu Cixin], [Su Tong], and [Han Shaogong]. Each section contains a stylized, simplified non-photorealistic 2D vector portrait capturing the author's likeness, the author's name in Chinese characters, [1-2] representative book titles, style tags such as [realism, avant-garde literature, youth literature, historical narrative, magical realism, science fiction], and a concise one-sentence profile description. Neat, balanced typography and modern editorial layout suitable for an educational literary infographic.

infographicposterchinese literature
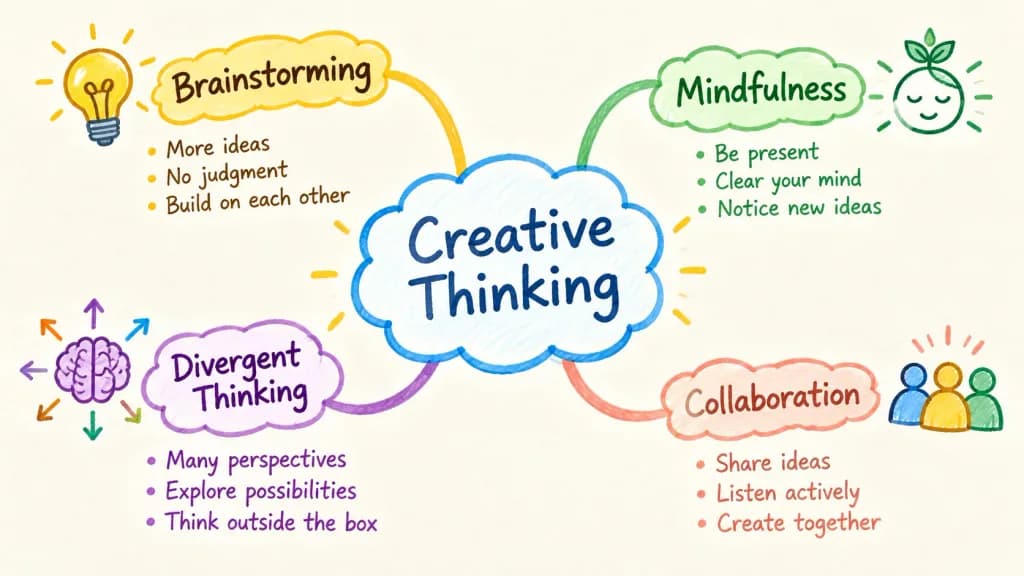
Creative Thinking Colorful Mind Map

Creative Thinking Colorful Mind Map

A vibrant and organic mind map illustration centered around the topic of "[Creative Thinking]". The central core is drawn in a soft cloud-like bubble, with curved branches extending outward to sub-topics: "[Brainstorming]", "[Mindfulness]", "[Divergent Thinking]", and "[Collaboration]". Each branch features a distinct color palette and is accompanied by a small, relevant hand-drawn icon, such as a glowing lightbulb for ideas. Friendly, legible handwritten lettering throughout, set against a clean, lightly textured background for educational and brainstorming use.

mind mapinfographicbrainstorming
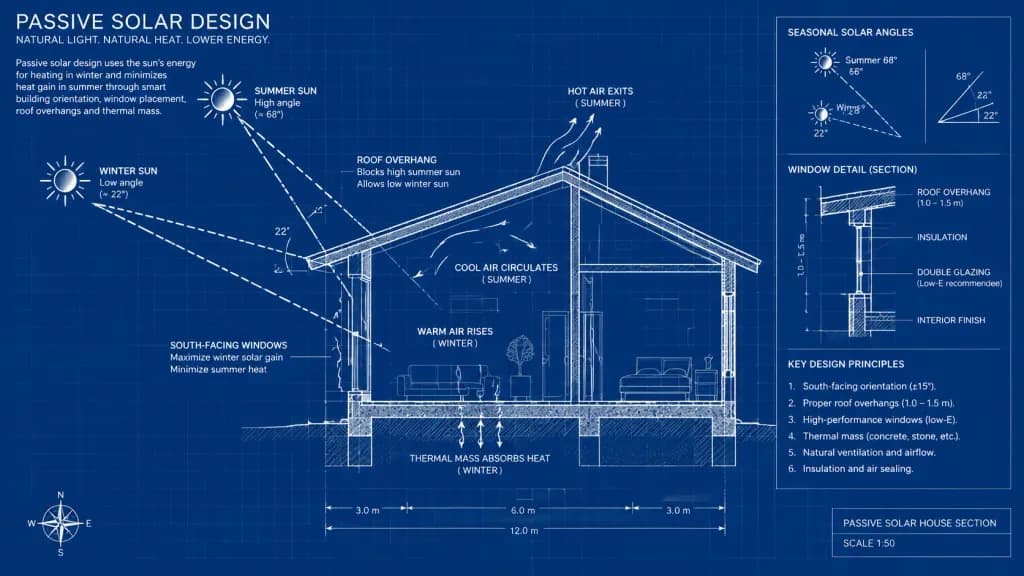
Passive Solar House Blueprint

Passive Solar House Blueprint

An architectural cross-section blueprint diagram explaining the concept of passive solar design in a [residential house]. Crisp white line drawing on a classic deep blue blueprint background, showing the contrasting angles of the sun in winter and summer. Clear technical schematics illustrate solar rays, roof overhangs, and window placement affecting seasonal heating and cooling. Accurate architectural drafting style with structural notes, dimension lines, and physics-based thermal airflow indicators.

blueprintarchitecturesolar design
3D E-Commerce Technical Architecture Diagram

3D E-Commerce Technical Architecture Diagram

A technical architecture flowchart diagram of an [e-commerce sales platform] rendered with an isometric three-dimensional perspective. Distinct layered module hierarchies are organized in tiered floating platforms, clearly displaying dynamic directional data flow arrows, glowing connection lines, and interaction logic between frontend clients, microservices, backend processing, and databases. Clean enterprise tech visualization style, high-contrast color coding for distinct system layers, subtle futuristic studio lighting.

technical architectureflowchart3d diagram
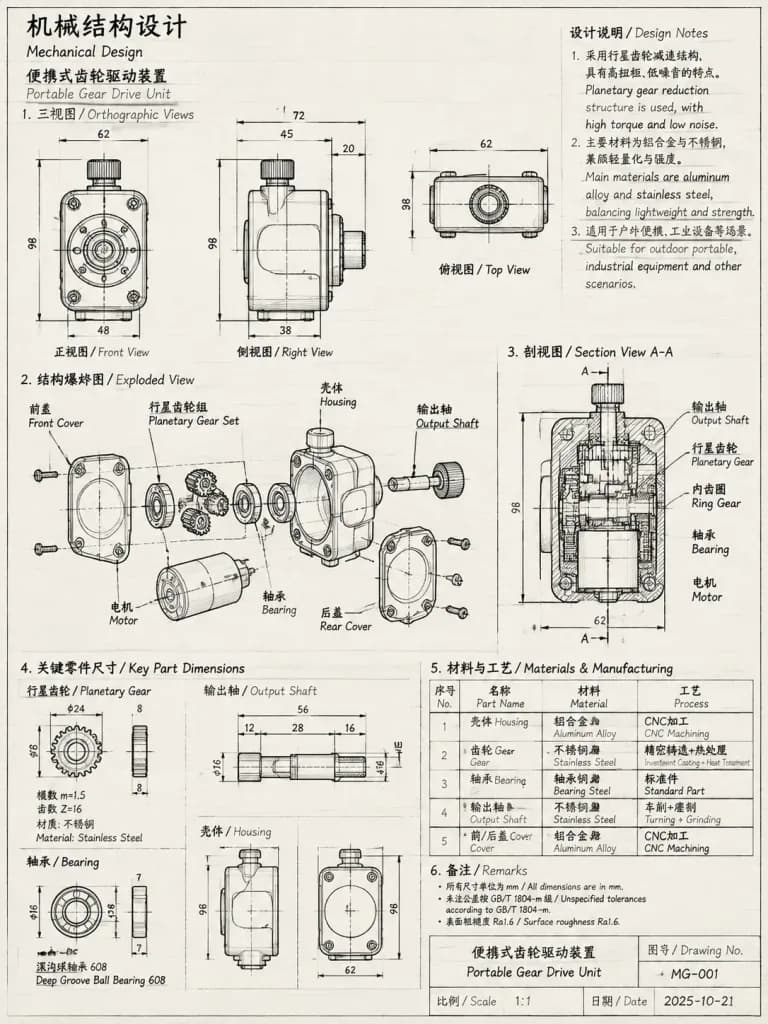
Technical Engineering Sketch Notebook Page

Technical Engineering Sketch Notebook Page

Black line sketch, [Mechanical Design] notes, dense notebook-style layout, featuring orthographic projections, technical dimensioning, callouts, name annotations, and bilingual Chinese-English explanatory labels.

technical drawingengineering sketchblueprint