
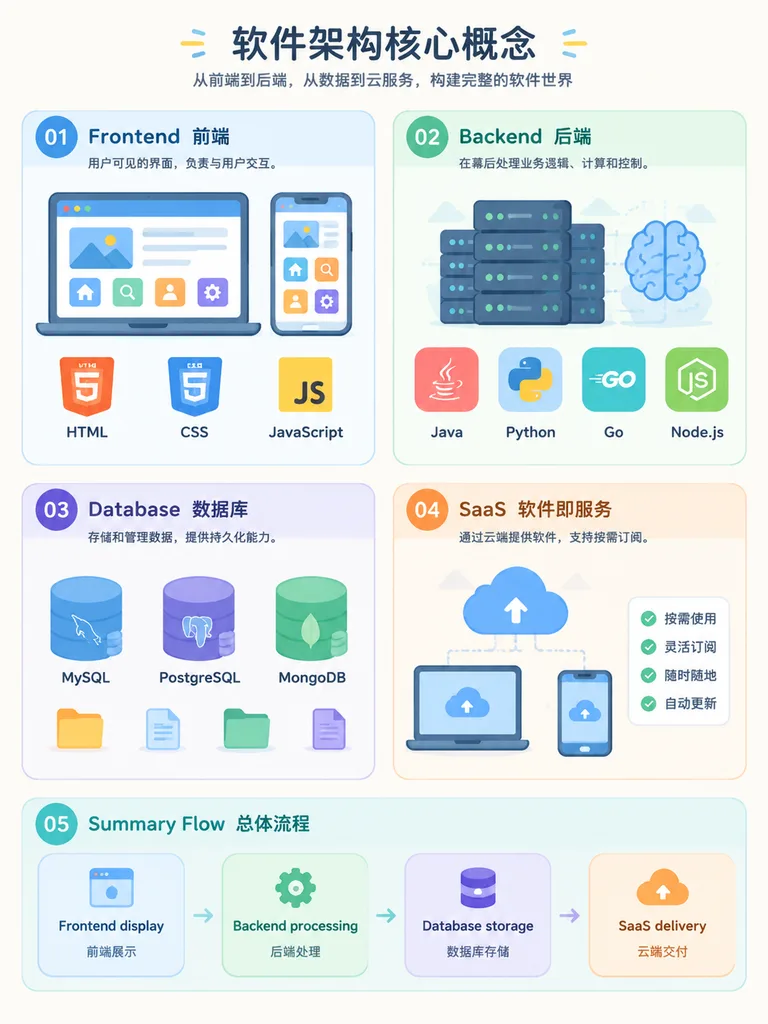
Yazılım Mimarisi Eğitici İnfografiği
Frontend, backend, veritabanı ve SaaS işleyişini açıklayan anlaşılır bir infografik oluşturur. Başlıkları ve dilleri ihtiyacınıza göre değiştirin.
İstem
An easy-to-understand educational infographic diagram explaining core software architecture concepts in an organized layout: - Section 01: [Frontend] - The user-visible interface, showing web browser and smartphone screens with icons for HTML, CSS, and JavaScript. - Section 02: [Backend] - The logic and calculation layer behind the scenes, featuring server racks and brain icons with tags for Java, Python, Go, and Node.js. - Section 03: [Database] - Data storage and memory, illustrated with relational table cylinders and document folder icons representing MySQL, PostgreSQL, and MongoDB. - Section 04: [SaaS] - Software as a Service, depicting cloud delivery and subscription models across desktop and mobile devices. - Section 05: [Summary Flow] - A horizontal connecting flowchart showing: [Frontend display → Backend processing → Database storage → SaaS delivery]. Style: Modern flat vector infographic, clean layout, pastel color-coded modules, minimalist tech icons, clear readable labels, on a soft off-white background.
Neleri özelleştirebilirsiniz
Oluşturmadan önce istemin bu kısımlarını kendi konunuz veya metninizle değiştirin.
[Frontend]yer tutucu[Backend]yer tutucu[Database]yer tutucu[SaaS]yer tutucu[Summary Flow]yer tutucu
İstem ayrıntıları
- Kategori
- İnfografik / Eğitim
- Model
- GPT IMAGE 2
- Görsel başına maliyet
- 1K: 43 kredi · 2K: 86 kredi · 4K: 143 kredi
- En boy oranı
- 3:4
- Eklenme