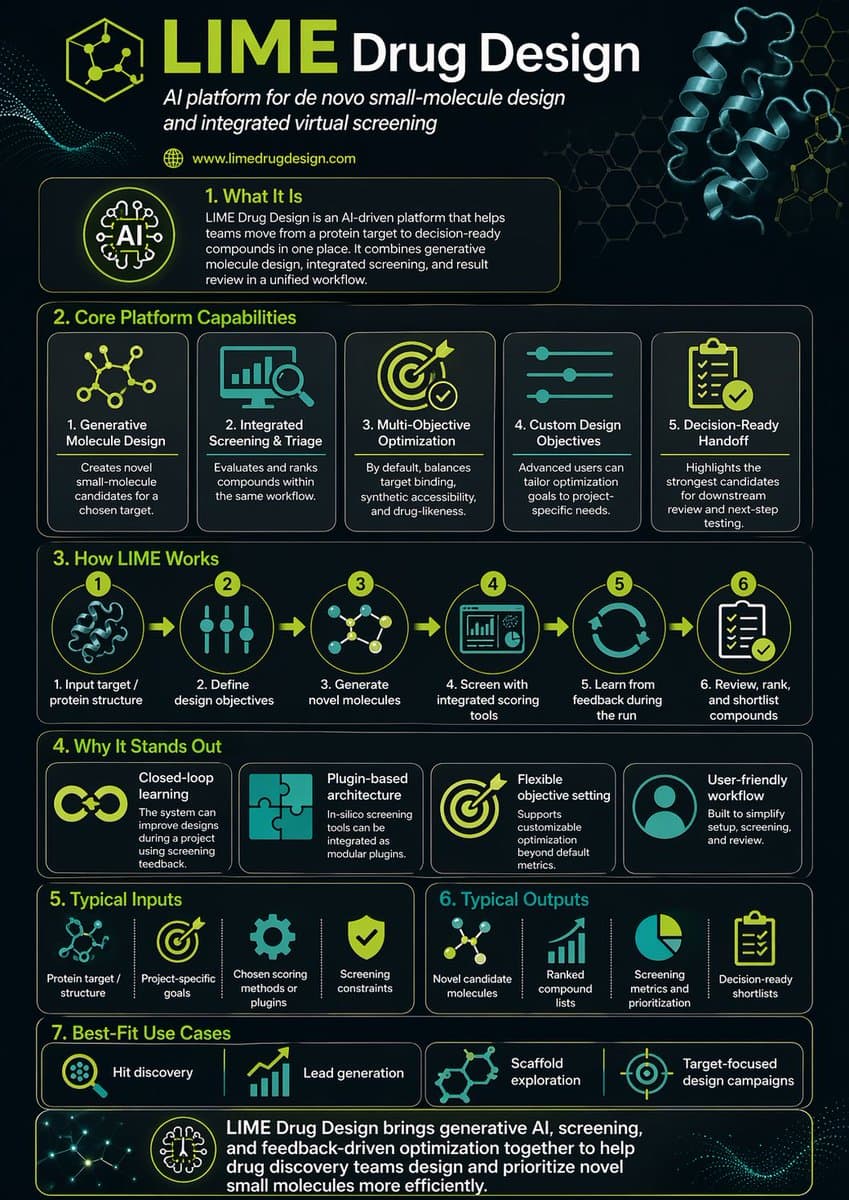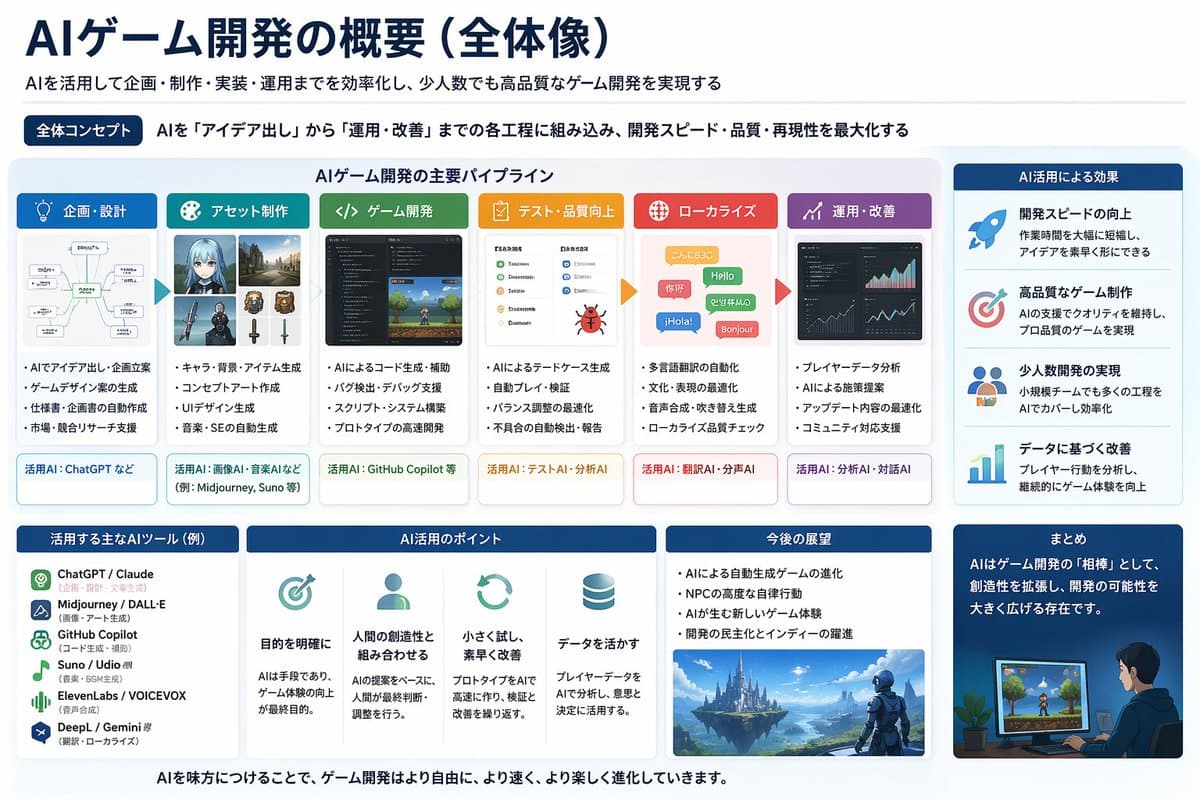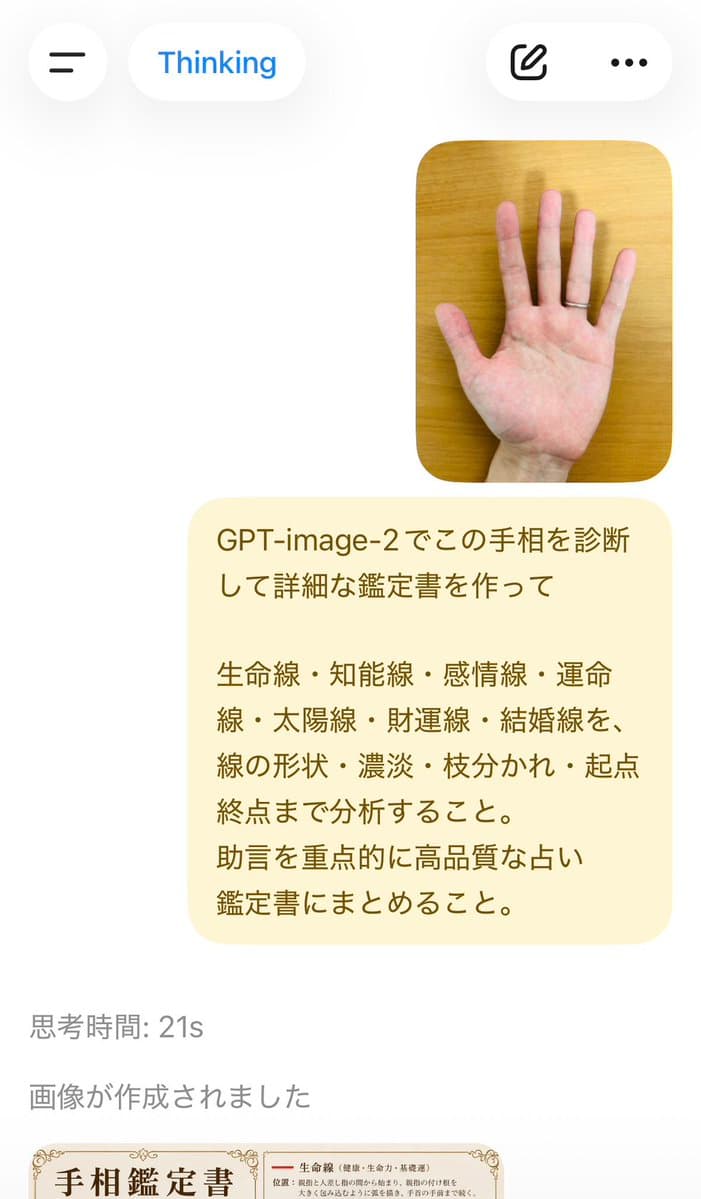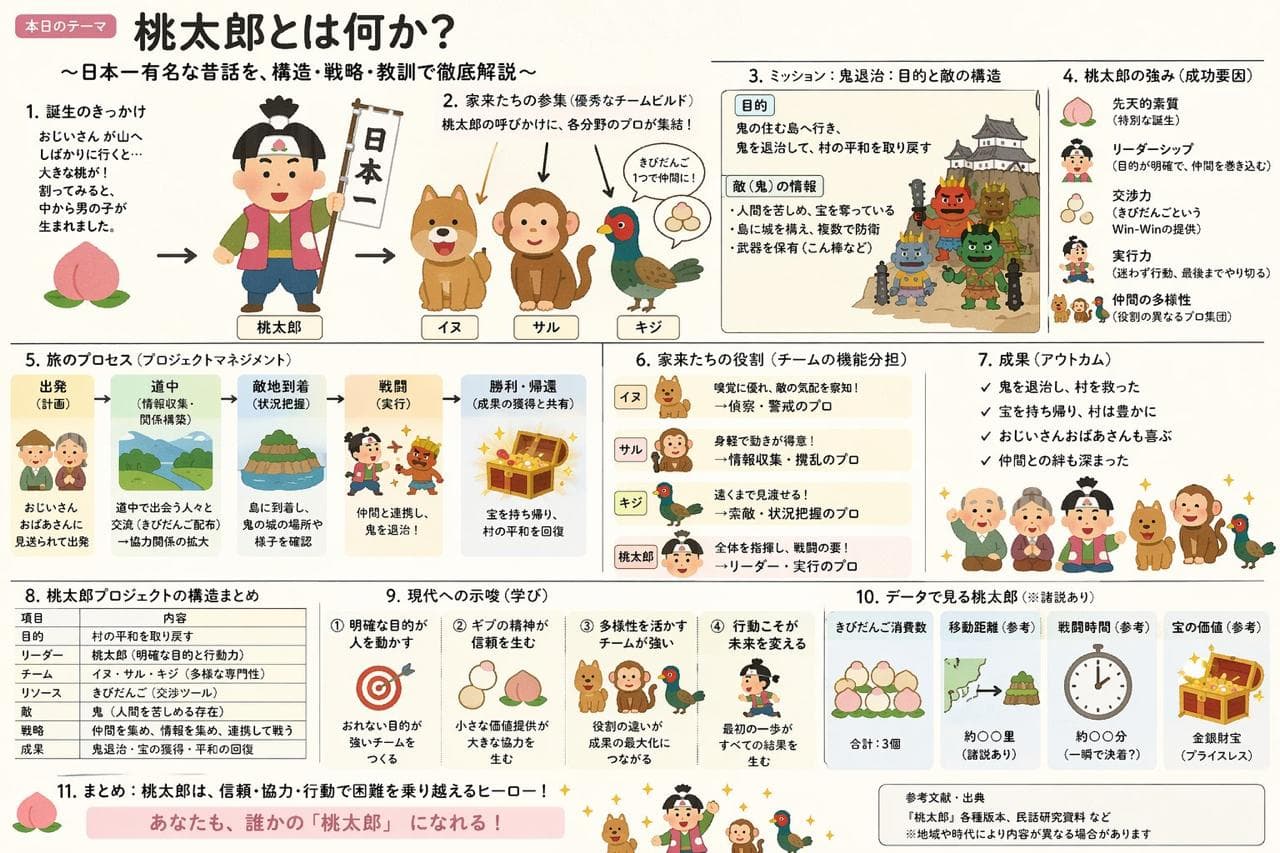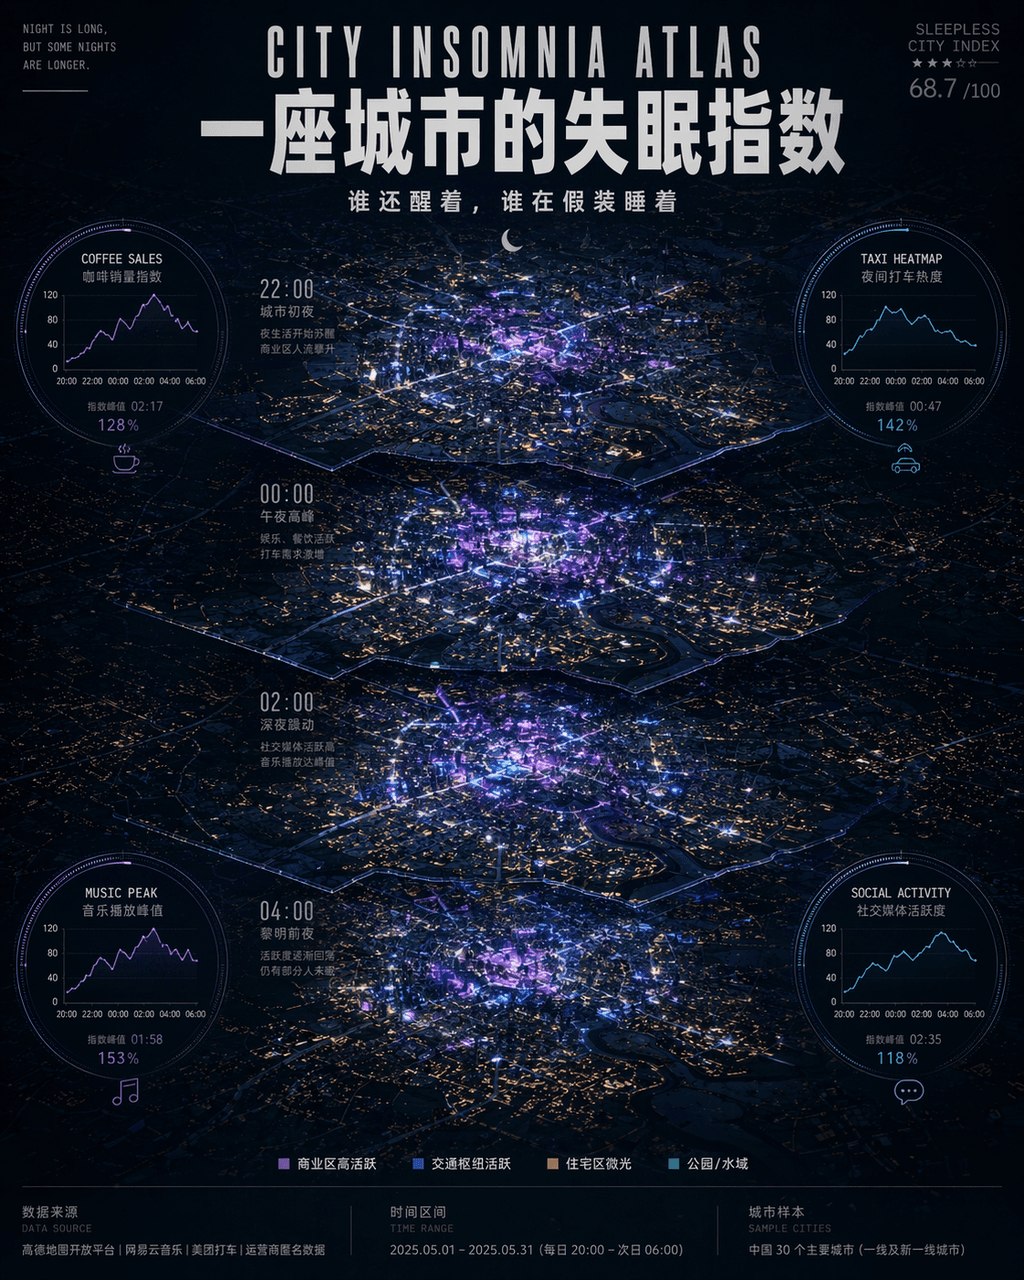
City Insomnia Index Poster
"A city's insomnia index"/"CITY INSOMNIA ATLAS", nightlife data visualization poster, the center is a top-down perspective of the city's night view map, according to late night 22:00, 00:00, 02:00, 04:00 The four time periods are illuminated in layers, with the commercial area highlighted in neon purple and electric blue, and the residential area presented in a dot matrix of dim yellow window light. Four circular data modules are embedded around the map: coffee sales curve, night taxi popularity, music playback peak, and social media activity. The title uses narrow uppercase English and Chinese bold overlapping, and the subtitle reads "Who is still awake and who is pretending to be asleep". The small characters at the bottom annotate the data source, time interval and city sample number. The overall visual reference is "Monocle" + Technology think tank report style, the atmosphere is between urban romance and mild anxiety, ratio 4:5.