
提示词
{
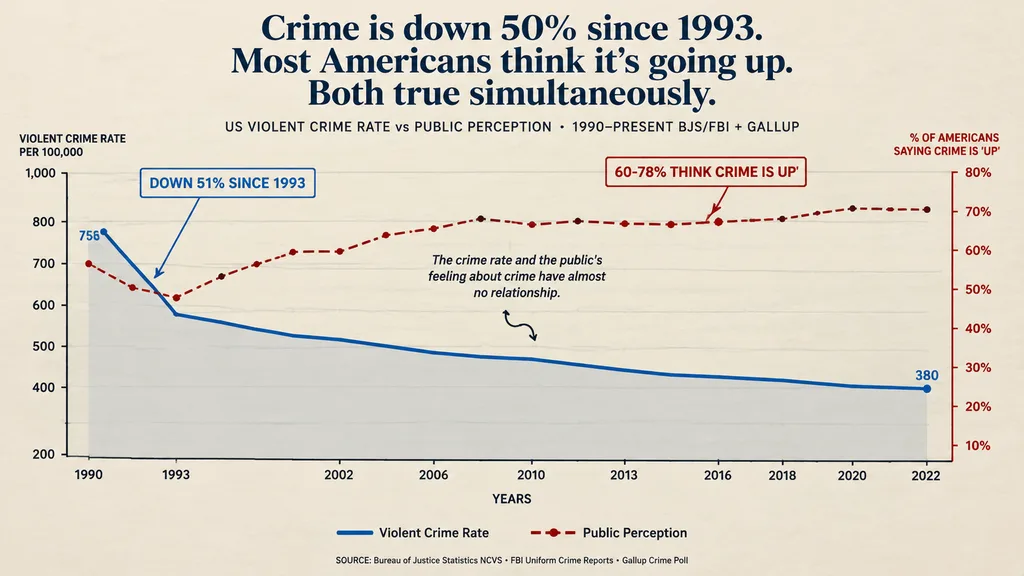
  "type": "双轴折线图信息图表",
  "style": "社论数据可视化风格,磨砂哑光纸纹理背景,简洁的新闻式排版设计",
  "typography": {
    "headline": "衬线字体,粗体,居中",
    "labels": "无衬线字体,简洁清爽,大小写混合"
  },
  "layout": {
    "header": {
      "main_title": "[Crime is down 50% since 1993. Most Americans think it's going up. Both true simultaneously.]",
      "subtitle": "US VIOLENT CRIME RATE vs PUBLIC PERCEPTION • 1990–PRESENT BJS/FBI + GALLUP"
    },
    "chart_area": {
      "background": "浅米色,带有微弱的水平网格线",
      "axes": {
        "x_axis": {
          "label": "Years",
          "ticks": [
            "1990",
            "1993",
            "2002",
            "2006",
            "2010",
            "2013",
            "2016",
            "2018",
            "2020",
            "2022"
          ]
        },
        "y_axis_left": {
          "label": "[Violent Crime Rate Per 100,000]",
          "scale": [
            "200",
            "400",
            "500",
            "600",
            "700",
            "800",
            "1000"
          ],
          "color": "黑色"
        },
        "y_axis_right": {
          "label": "[% of Americans Saying Crime Is 'Up']",
          "scale": [
            "10%",
            "20%",
            "30%",
            "40%",
            "50%",
            "60%",
            "70%",
            "80%"
          ],
          "color": "深红色"
        }
      },
      "data_series": [
        {
          "name": "Violent Crime Rate",
          "style": "粗实心蓝线,下方带有浅灰色阴影填充",
          "trend": "起步较高,急剧下降,随后持续稳定下滑",
          "data_labels": [
            "758",
            "380"
          ]
        },
        {
          "name": "Public Perception",
          "style": "带小圆点标记的虚线深红线",
          "trend": "波动但总体呈现上升趋势并维持高位"
        }
      ],
      "annotations": [
        {
          "text": "[DOWN 51% SINCE 1993]",
          "style": "带指示箭头的标注框,蓝色文字",
          "position": "左上部,指向蓝线下降处"
        },
        {
          "text": "[60-78% THINK CRIME IS UP]",
          "style": "带指示箭头的标注框,红色文字",
          "position": "右中部,指向虚线红线"
        },
        {
          "text": "[The crime rate and the public's feeling about crime have almost no relationship.]",
          "style": "带小弯箭头的浮动见解文本",
          "position": "中央,位于两条折线之间"
        }
      ]
    },
    "footer": {
      "source_text": "SOURCE: Bureau of Justice Statistics NCVS • FBI Uniform Crime Reports • Gallup Crime Poll"
    }
  }
}可以替换的部分
生成前,把提示词里的这些部分换成你自己的主题或文案。
[Violent Crime Rate Per 100,000]占位符[% of Americans Saying Crime Is 'Up']占位符[DOWN 51% SINCE 1993]占位符[60-78% THINK CRIME IS UP]占位符
提示词信息
- 分类
- 信息图与教育
- 模型
- GPT IMAGE 2
- 每张图消耗
- 1K:43 积分 · 2K:86 积分 · 4K:143 积分
- 画幅比例
- 16:9
- 收录时间