
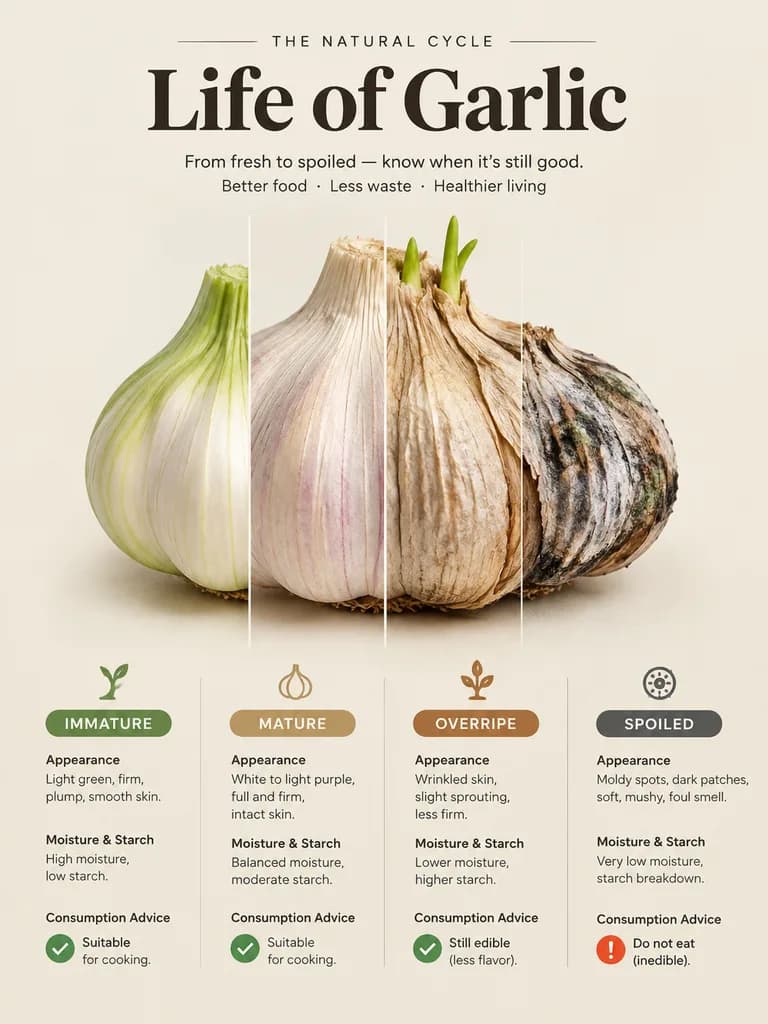
Food Lifecycle Time Slice Infographic
Generate an educational time-slice infographic tracking the decay and maturation of a food item. Customize the bracketed food name to visualize any fruit, vegetable, or ingredient.
Prompt
An educational infographic poster titled "Life of [Garlic]" in a clean Little Red Book social media style. The composition features a single complete [head of garlic] horizontally centered, seamlessly divided into 4 to 5 vertical slice segments representing chronological time progression from left to right: Immature, Mature, Overripe, and Spoiled. The food item maintains consistent anatomical structure and continuous contour across the slices, but transitions realistically across each segment in color, texture, and physical characteristics (from fresh and plump, to peak ripe, to wrinkling/sprouting, to moldy and decaying). Each segment has clean vertical dividing lines and educational text callouts below: stage name, appearance traits, internal moisture and starch changes, and consumption advice with icons (✔️ suitable for cooking, ⚠️ spoiled/inedible). Style: hyperrealistic studio photography on a clean minimalist light beige background, soft diffused lighting, crisp typography and elegant educational layout.
What you can customize
Swap these parts of the prompt for your own subject or wording before you generate.
[Garlic]placeholder[head of garlic]placeholder“Life of [Garlic]”quoted wording
Prompt details
- Category
- Infographic / Education
- Model
- GPT IMAGE 2
- Cost per image
- 1K: 43 credits · 2K: 86 credits · 4K: 143 credits
- Aspect ratio
- 3:4
- Added