
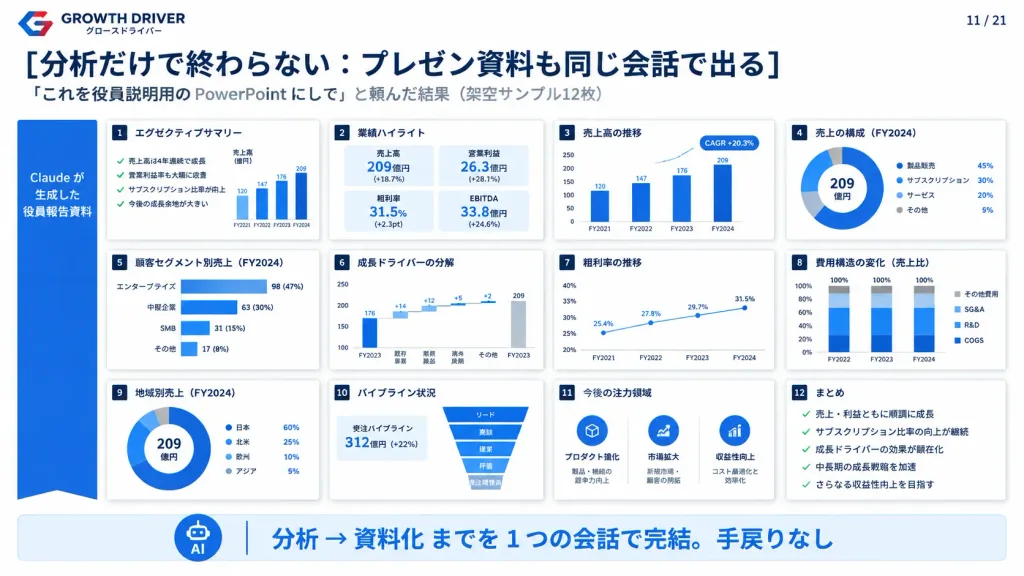
Corporate Executive Presentation Deck Slide Overview
Generates a management consulting slide layout featuring 12 miniature executive presentation cards. Adjust company branding, headline copy, and chart metrics inside the bracketed terms to tailor the report.
Prompt
Clean Japanese corporate presentation slide for [GROWTH DRIVER], demonstrating an AI tool converting complex analysis into executive board PowerPoint decks in a single conversation. Canvas: 16:9 widescreen presentation slide, solid white background, high-end management consulting slide aesthetic with navy blue (#0F2042) and bright blue accents, precise grid alignment, subtle drop shadows, crisp vector data visualizations, and realistic miniature slide thumbnails. Header: Top-left features an angular red and blue corporate logo mark alongside the brand text "GROWTH DRIVER" and Japanese subtext "グロースドライバー". Top-right displays page indicator "11 / 21". Prominent bold navy Japanese headline reads: "[分析だけで終わらない:プレゼン資料も同じ会話で出る]". Beneath it, a gray secondary subtitle reads: "[「これを役員説明用の PowerPoint にして」と頼んだ結果(架空サンプル12枚)]". Layout: Left side includes a vertical blue ribbon label reading "Claude が生成した 役員報告資料". The central area showcases exactly 12 miniature white slide cards organized in a balanced 4-column by 3-row grid. Each card has a small navy numbered badge (1 to 12) in its upper-left corner, a crisp Japanese section title, miniature charts, and subtle gray borders with soft shadows. The 12 cards feature: 1. "エグゼクティブサマリー" — Four checklist bullet points with green checkmarks alongside a micro bar chart (FY2021–FY2024: 120, 147, 176, 209). 2. "業績ハイライト" — Four KPI metric boxes: 売上高 209億円 (+18.7%), 営業利益 26.3億円 (+28.1%), 粗利率 31.5% (+2.3pt), EBITDA 33.8億円 (+24.6%). 3. "売上高の推移" — Vertical blue bar chart across FY2021–FY2024 with a callout bubble: "CAGR +20.3%". 4. "売上の構成(FY2024)" — Donut chart showing "209 億円" centered, with legend: 製品販売 45%, サブスクリプション 30%, サービス 20%, その他 5%. 5. "顧客セグメント別売上(FY2024)" — Horizontal bar chart: エンタープライズ 98 (47%), 中堅企業 63 (30%), SMB 31 (15%), その他 17 (8%). 6. "成長ドライバーの分解" — Waterfall bridge chart starting at FY2023 176 through increments +14, +12, +5, +2 to FY2024 209. 7. "粗利率の推移" — Upward trending blue line chart (FY2021: 25.4% to FY2024: 31.5%). 8. "費用構造の変化(売上比)" — Stacked column chart across FY2022–FY2024 breaking down COGS, R&D, SG&A, and other expenses. 9. "地域別売上(FY2024)" — Donut chart with center text "209 億円" and legend: 日本 60%, 北米 25%, 欧州 10%, アジア 5%. 10. "パイプライン状況" — Funnel pipeline graphic with headline metrics: 受注パイプライン 312億円 (+22%) and sales funnel stages from リード to 受注確度高. 11. "今後の注力領域" — Three circular blue icons with strategy labels: プロダクト強化, 市場拡大, 収益性向上. 12. "まとめ" — Summary card featuring five checkmarked bullet points. Bottom Banner: Full-width rounded light-blue callout bar across the bottom. At the far left, a clean circular AI assistant icon. Prominent bold blue Japanese text reads: "[分析 → 資料化 までを 1 つの会話で完結。手戻りなし]". Style: Professional business consulting deck, high information density, razor-sharp typography, minimalist graphic layout, no human figures, no photos, vector-clean execution.
What you can customize
Swap these parts of the prompt for your own subject or wording before you generate.
[GROWTH DRIVER]placeholder[分析だけで終わらない:プレゼン資料も同じ会話で出る]placeholder[「これを役員説明用の PowerPoint にして」と頼んだ結果(架空サンプル12枚)]placeholder[分析 → 資料化 までを 1 つの会話で完結。手戻りなし]placeholder“GROWTH DRIVER”quoted wording“グロースドライバー”quoted wording“11 / 21”quoted wording“Claude が生成した 役員報告資料”quoted wording
Prompt details
- Category
- Infographic / Education
- Model
- GPT IMAGE 2
- Cost per image
- 1K: 43 credits · 2K: 86 credits · 4K: 143 credits
- Aspect ratio
- 16:9
- Added