
B2B SaaS Pitch Deck Grid
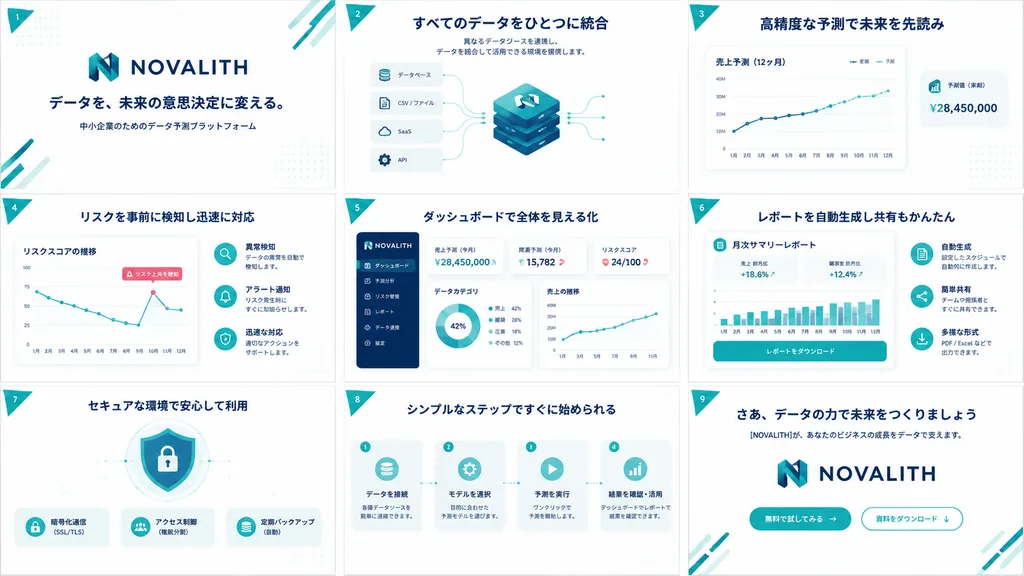
Generates a clean 3x3 overview sheet of 9 Japanese B2B SaaS presentation slides. Customize the brand name, headline copy, or color palette to suit different enterprise software pitches.
Prompt
A clean, high-end Japanese B2B SaaS pitch deck and service concept board for [NOVALITH], displayed as exactly 9 widescreen 16:9 slides arranged in a 3x3 grid overview sheet. Canvas and layout: Landscape orientation, uniform white background, evenly spaced slides separated by thin pale borders. Color palette of corporate deep navy, vibrant teal, soft cyan accents, subtle dot grid textures, and a small teal triangular ribbon on the top-left of each slide displaying white numerals 1 through 9. Visual style: Modern Japanese enterprise tech aesthetic, crisp vector UI elements, minimal gradients, soft drop shadows, rounded container cards, thin teal telemetry lines, bold navy headings, and generous whitespace. Brand identity features a stylized geometric 'N' emblem in teal and navy with the uppercase wordmark [NOVALITH]. Vector icons, UI dashboards, and abstract technical diagrams only; no human photographs. Typography and language: All slide text in crisp Japanese typography with bold navy headlines and small legible subtext. Slide contents: 1. Cover: Large [NOVALITH] logo centered above headline 「データを、未来の意思決定に変える。」 and subtext 「中小企業のためのデータ予測プラットフォーム」, with teal diagonal corner lines. 2. Data Integration: Headline 「すべてのデータをひとつに統合」 with short integration subtext. Central stacked isometric database cube with the N logo, connected to 4 input cards labeled 「データベース」, 「CSV / ファイル」, 「SaaS」, and 「API」. 3. Forecasting: Headline 「高精度な予測で未来を先読み」. Large line chart card 「売上予測(12ヶ月)」 with legends 「実績」 and 「予測」, upward trendline, and floating KPI card 「予測値(来期)¥28,450,000」. 4. Risk Detection: Headline 「リスクを事前に検知し迅速に対応」. Line chart card 「リスクスコアの推移」 with declining zigzag path and callout 「リスク上昇を検知」. Right side features 3 circular icon rows for anomaly detection, alerts, and response. 5. Dashboard UI: Headline 「ダッシュボードで全体を見える化」. SaaS dashboard mockup with navy left navigation sidebar (6 menu items), KPI cards (「売上予測(今月)¥28,450,000」, 「需要予測(今月)15,782」, 「リスクスコア 24/100」), a donut chart, and a sales line graph. 6. Automated Reports: Headline 「レポートを自動生成し共有もかんたん」. Central document card titled 「月次サマリーレポート」 with metrics (+18.6%, +12.4%), a teal bar chart, and action button 「レポートをダウンロード」. 7. Security: Headline 「セキュアな環境で安心して利用」. Center shield and padlock graphic with 3 feature badges below: 「暗号化通信(SSL/TLS)」, 「アクセス制御(権限分割)」, and 「定期バックアップ(自動)」. 8. Process Steps: Headline 「シンプルなステップですぐに始められる」. 4 sequential workflow cards linked by dotted arrows: 「データを接続」, 「モデルを選択」, 「予測を実行」, and 「結果を確認・活用」. 9. Closing / CTA: Headline 「さあ、データの力で未来をつくりましょう」, subtext 「[NOVALITH]が、あなたのビジネスの成長をデータで支えます。」, large centered logo, and 2 CTA buttons: filled teal 「無料で試してみる →」 and outlined 「資料をダウンロード ↓」. Constraints: Unified branding, exact 3x3 layout, no stock photography, no extra slide tiles.
What you can customize
Swap these parts of the prompt for your own subject or wording before you generate.
[NOVALITH]placeholder“データを、未来の意思決定に変える。”quoted wording“中小企業のためのデータ予測プラットフォーム”quoted wording“すべてのデータをひとつに統合”quoted wording“データベース”quoted wording“CSV / ファイル”quoted wording“SaaS”quoted wording“API”quoted wording
Prompt details
- Category
- UI / UX Design
- Model
- GPT IMAGE 2
- Cost per image
- 1K: 43 credits · 2K: 86 credits · 4K: 143 credits
- Aspect ratio
- 16:9
- Added