
Infographic / Education
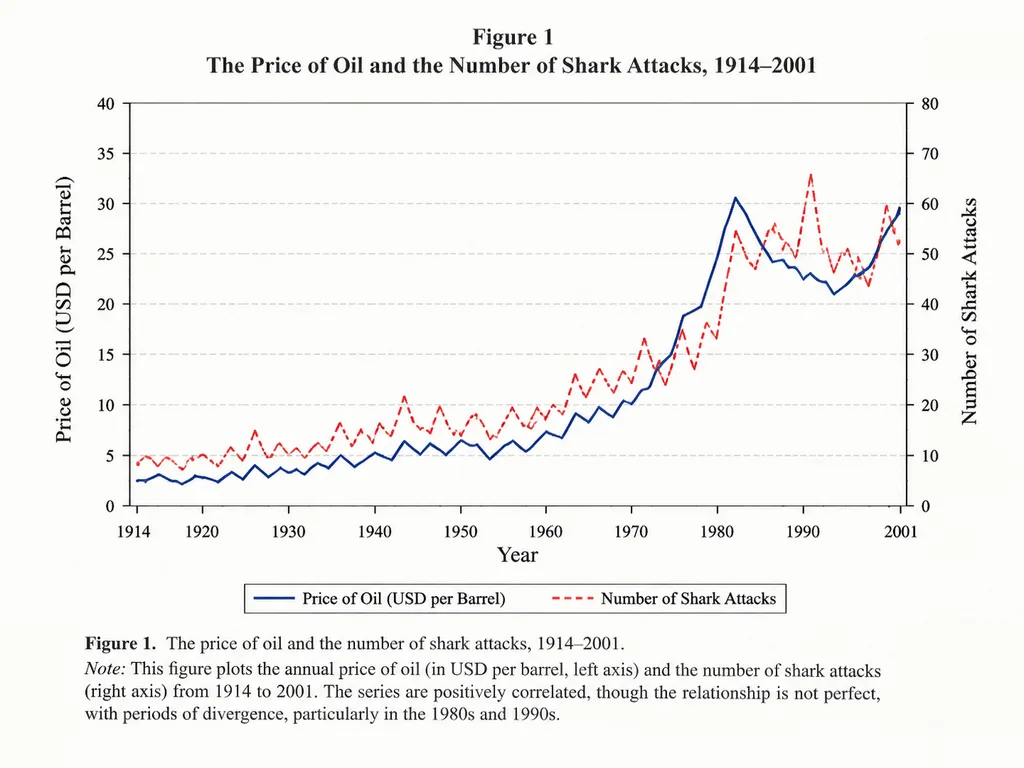
Academic Correlation Line Graph
Generates an authentic academic journal chart comparing two variables over time. Adjust the paper topic, plotted variables, and time span to create custom or humorous spurious correlation graphs.
line graphchartinfographicacademic papereconomicsdata visualization
Browse similar promptsInfographic AI prompts
Prompt
An academic line graph figure from a prestigious [economics paper], demonstrating a close but imperfect correlation between [the price of oil] and [the number of shark attacks] across [the years 1914 to 2001]. The chart features clean dual y-axes, distinct trend lines, labeled axes, a neat legend, subtle grid lines, traditional serif academic typography, and a formal figure caption at the bottom, styled like a scan of a printed scholarly journal.
What you can customize
Swap these parts of the prompt for your own subject or wording before you generate.
[economics paper]placeholder[the price of oil]placeholder[the number of shark attacks]placeholder[the years 1914 to 2001]placeholder
Prompt details
- Category
- Infographic / Education
- Model
- GPT IMAGE 2
- Cost per image
- 1K: 43 credits · 2K: 86 credits · 4K: 143 credits
- Aspect ratio
- 4:3
- Added