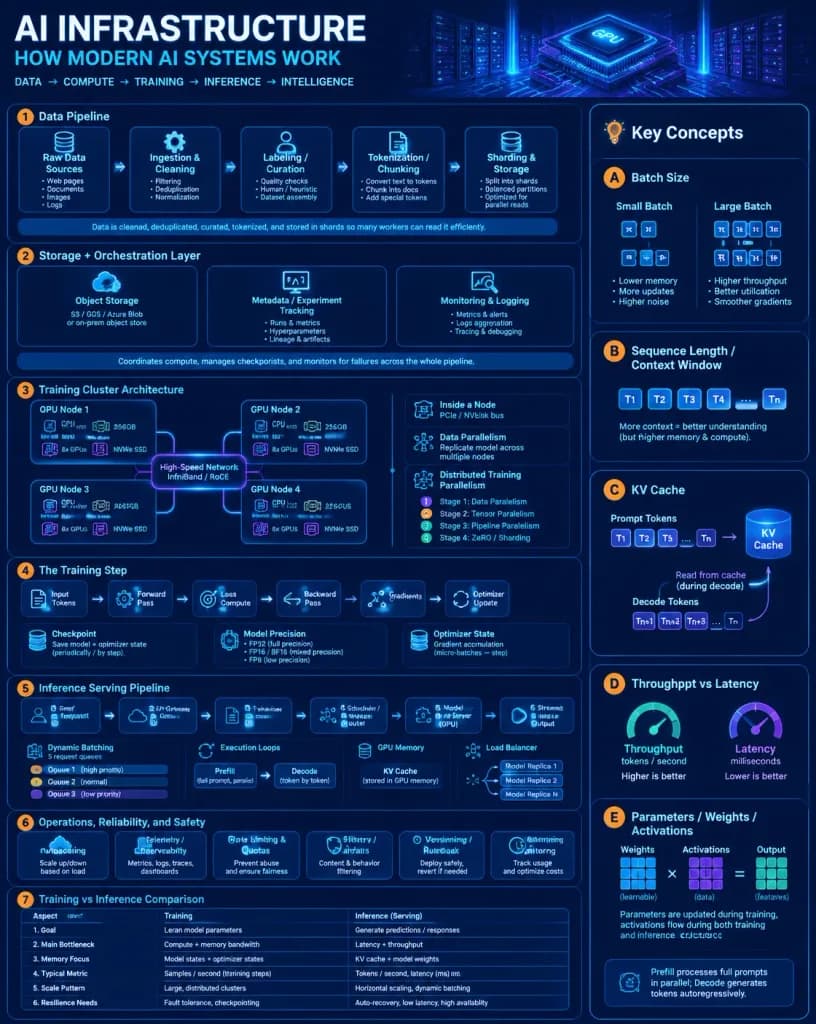
A dense, highly polished vertical educational infographic poster titled "[AI INFRASTRUCTURE]" with the subtitle "[HOW MODERN AI SYSTEMS WORK]", explaining modern AI infrastructure from data pipelines and GPU training clusters to inference serving, dynamic batching, and KV cache.
Style & Atmosphere: Dark navy futuristic data-center aesthetic, glowing blue and purple cybernetic grid background with subtle stylized server racks, silicon GPU chip graphics, neon circuit traces, thin rounded panels, crisp white and cyan typography, and vibrant orange numbered badges. Clean, highly technical, and legible visual architecture.
Layout:
- Top banner: Large bold title on top left, subtitle and technical tagline underneath, decorative glowing server rack and GPU processor illustration on top right.
- Main structure: Exactly 8 numbered core sections, a dedicated right-hand "Key Concepts" sidebar column, and a bottom workflow footer.
Sections & Content Details:
1. Data Pipeline: 5 sequential stages connected by arrows: Raw Data Sources (bullets: Web pages, Documents, Code, Images, Logs), Ingestion & Cleaning (bullets: Filtering, Deduplication, Normalization), Labeling / Curation (bullets: Quality checks, Human / heuristic, Dataset assembly), Tokenization / Chunking (bullets: Convert text to tokens, Chunk into docs, Add special tokens), Sharding & Storage (bullets: Split into shards, Balanced partitions, Optimized for parallel reads). Bottom caption: "Data is cleaned, deduplicated, curated, tokenized, and stored in shards so many workers can read it efficiently."
2. Storage + Orchestration Layer: 3 vertical cards: Object Storage (cloud/database icon, note "S3 / GCS / Azure Blob or on-prem object store"), Metadata / Experiment Tracking (dashboard icon, bullets: Runs & metrics, Hyperparameters, Lineage & artifacts), Monitoring & Logging (chart/lens icon, bullets: Metrics & alerts, Logs aggregation, Tracing & debugging). Footer note summarizing compute coordination, checkpoints, and failure monitoring.
3. Training Cluster Architecture: Central diagram titled "Training Cluster Architecture" with 4 GPU node boxes in a 2x2 grid linked by glowing connections labeled "High-Speed Network InfiniBand / RoCE". Each node shows CPU Host, RAM, 8x GPUs, NVMe SSD. Sub-panels: "Inside a Node" (PCIe/NVLink bus), "Data Parallelism", and "Distributed Training Parallelism" legend (Stages 1 through 4).
4. The Training Step: Left-to-right 6-step flow: Input Tokens -> Forward Pass -> Loss Compute -> Backward Pass -> Gradients -> Optimizer Update. Checkpoint stack graphic, Model Precision panel (FP32, FP16/BF16, FP8), and Optimizer State panel with gradient accumulation arrows.
5. Inference Serving Pipeline: 6-step horizontal sequence: User Request -> API Gateway -> Tokenizer -> Scheduler / Router -> Model Server (GPU) -> Streamed Output. Details include Dynamic Batching with 3 request queues, Prefill vs Decode execution loops, GPU memory KV Cache, and a load balancer routing to Model Replicas 1, 2, and N.
6. Operations, Reliability, and Safety: 6 rounded operational feature cards with icons: Autoscaling, Telemetry / Observability, Rate Limiting & Quotas, Safety Filters / Guardrails, Versioning / Rollback, Cost Monitoring.
7. Training vs Inference Comparison Table: A 6-row by 2-column comparative table evaluating Training vs Inference (Serving) across Goal, Main Bottleneck, Memory Focus, Typical Metric, Scale Pattern, and Resilience Needs.
8. Key Concepts Sidebar: Vertical right-side column with 5 lettered cards:
- A. Batch Size (small vs large batch diagram with token icons)
- B. Sequence Length / Context Window (prompt token blocks T1 through Tn)
- C. KV Cache (prompt tokens feeding a cylindrical cache block, decode reading from cache)
- D. Throughput vs Latency (dual gauge indicators)
- E. Parameters / Weights / Activations (multiplied matrix grid schematics)
- Bottom note: "Prefill processes full prompts in parallel; Decode generates tokens autoregressively."
infografikaaicentrum-danych