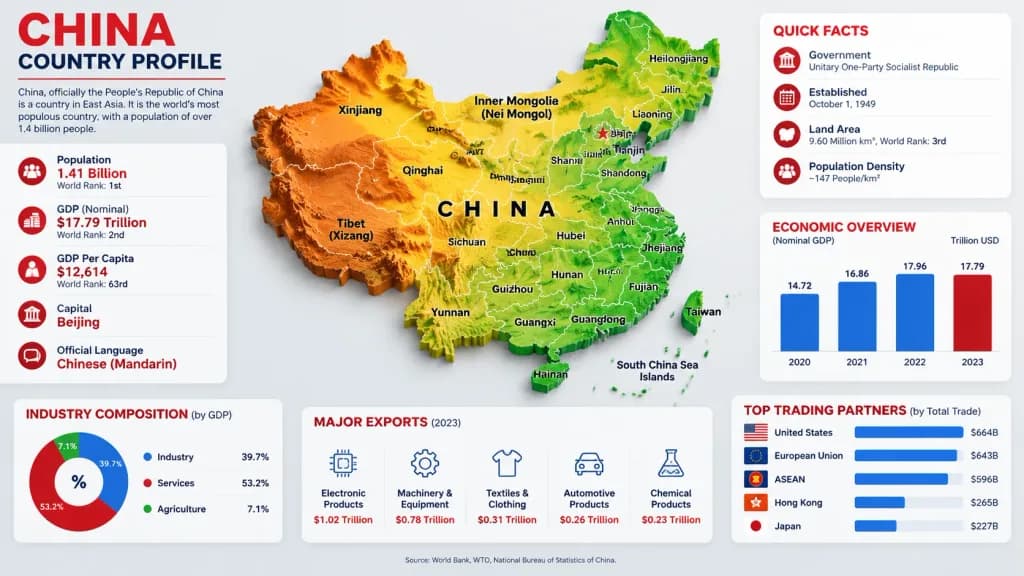
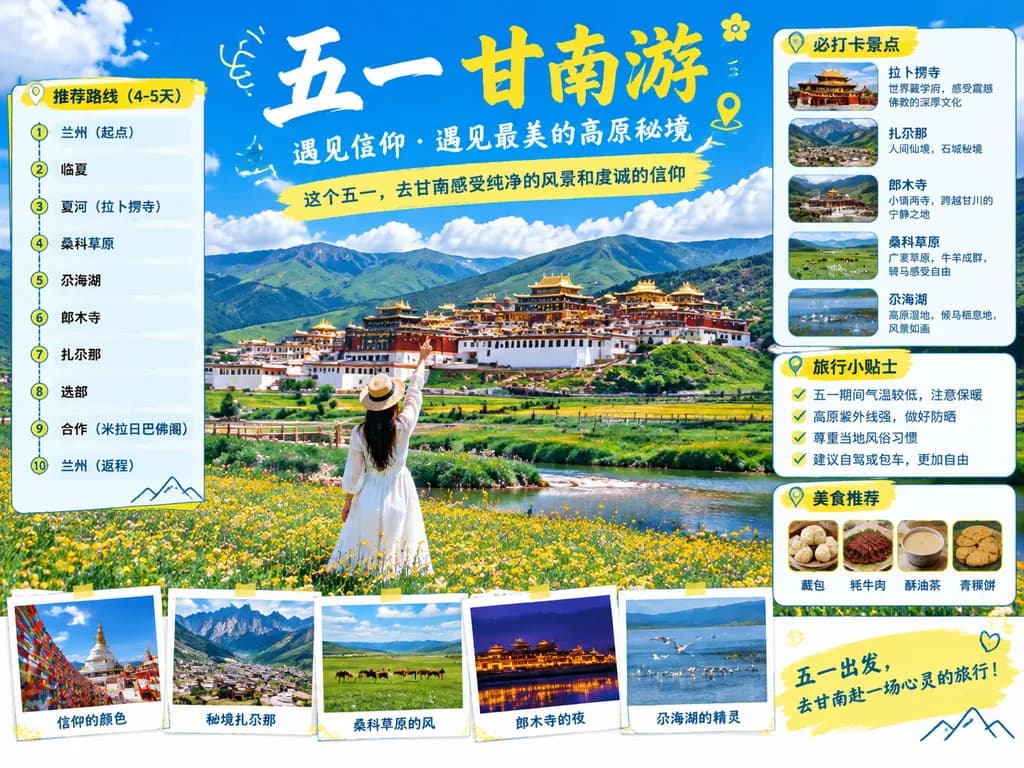
Clean, modern country-profile infographic titled "CHINA COUNTRY PROFILE" in a 16:9 horizontal format with a light gray background, crisp corporate editorial layout, subtle drop shadows, red, blue, and green accents, and a high-resolution 3D-meets-vector aesthetic.
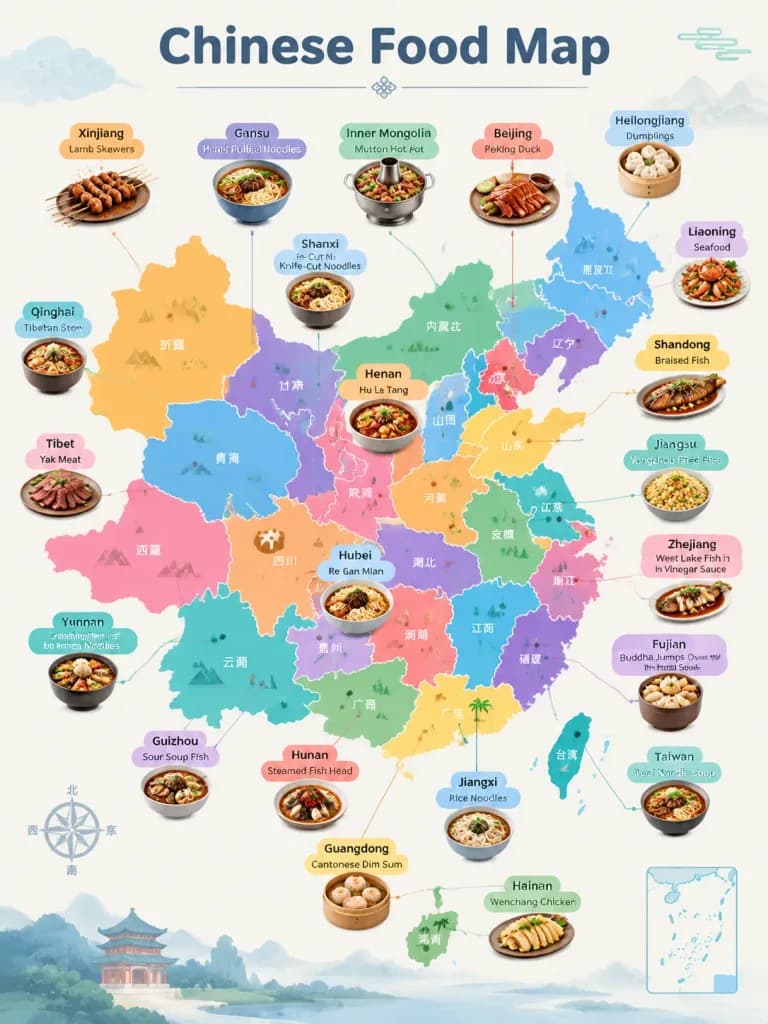
Center: Large raised 3D topographic relief map of [China] occupying the main central area. Terrain coloration features orange-brown mountains in the west, yellow central plateau, and green eastern lowlands and coastal regions. Crisp white provincial borders with black labels. Taiwan, Hainan, and South China Sea islands are separate raised pieces. Spaced black typography "CHINA" across the center. [Beijing] marked with a red star and label. Visible province/region labels include: Xinjiang, Tibet (Xizang), Qinghai, Gansu, Inner Mongolia (Nei Mongol), Ningxia, Sichuan, Yunnan, Guizhou, Guangxi, Guangdong, Hainan, Fujian, Zhejiang, Jiangsu, Anhui, Shandong, Hubei, Hunan, Shaanxi, Shanxi, Beijing, Tianjin, Liaoning, Jilin, Heilongjiang, Taiwan, and China.
Top-left: Headline block with big red text "CHINA", dark subtitle "COUNTRY PROFILE", a thin red dividing line, and paragraph text: "China, officially the People’s Republic of China is a country in East Asia. It is the world’s most populous country, with a population of over 1.4 billion people."
Left side: Tall rounded white statistics card with 5 stacked rows, red circular icons, and thin dividers:
- Population — [1.41 Billion] — World Rank: 1st
- GDP (Nominal) — $17.79 Trillion — World Rank: 2nd
- GDP Per Capita — $12,614 — World Rank: 63rd
- Capital — [Beijing]
- Official Language — [Chinese (Mandarin)]
Top-right: Rounded white card titled "QUICK FACTS" in red, with 4 red icon rows:
- Government — Unitary One-Party Socialist Republic
- Established — October 1, 1949
- Land Area — 9.60 Million km², World Rank: 3rd
- Population Density — ~147 People/km²
Middle-right: Rounded white card titled "ECONOMIC OVERVIEW" with subtitle "(Nominal GDP)" and unit "Trillion USD". Bar chart with 4 vertical bars: 2020 (14.72, blue), 2021 (16.86, blue), 2022 (17.96, blue), 2023 (17.79, red).
Bottom-left: Rounded white card titled "INDUSTRY COMPOSITION (by GDP)" containing a 3-part donut chart: Industry 39.7% (blue), Services 53.2% (red), Agriculture 7.1% (green), with a matching labeled legend.
Bottom-center: Rounded white card titled "MAJOR EXPORTS (2023)" with 5 columns, blue line icons, and red text values: Electronic Products ($1.02 Trillion), Machinery & Equipment ($0.78 Trillion), Textiles & Clothing ($0.31 Trillion), Automotive Products ($0.26 Trillion), Chemical Products ($0.23 Trillion).
Bottom-right: Rounded white card titled "TOP TRADING PARTNERS (by Total Trade)" with 5 horizontal blue bars and mini flags: United States ($664B), European Union ($643B), ASEAN ($596B), Hong Kong ($265B), Japan ($227B).
Bottom footer: Centered small text: "Source: World Bank, WTO, National Bureau of Statistics of China."
Layout constraints: Peripheral statistical cards arranged cleanly around the central map without overlapping it; uniform rounded card corners, crisp typography, clean data visualization hierarchy.
อินโฟกราฟิกภูมิประเทศประเทศจีน