
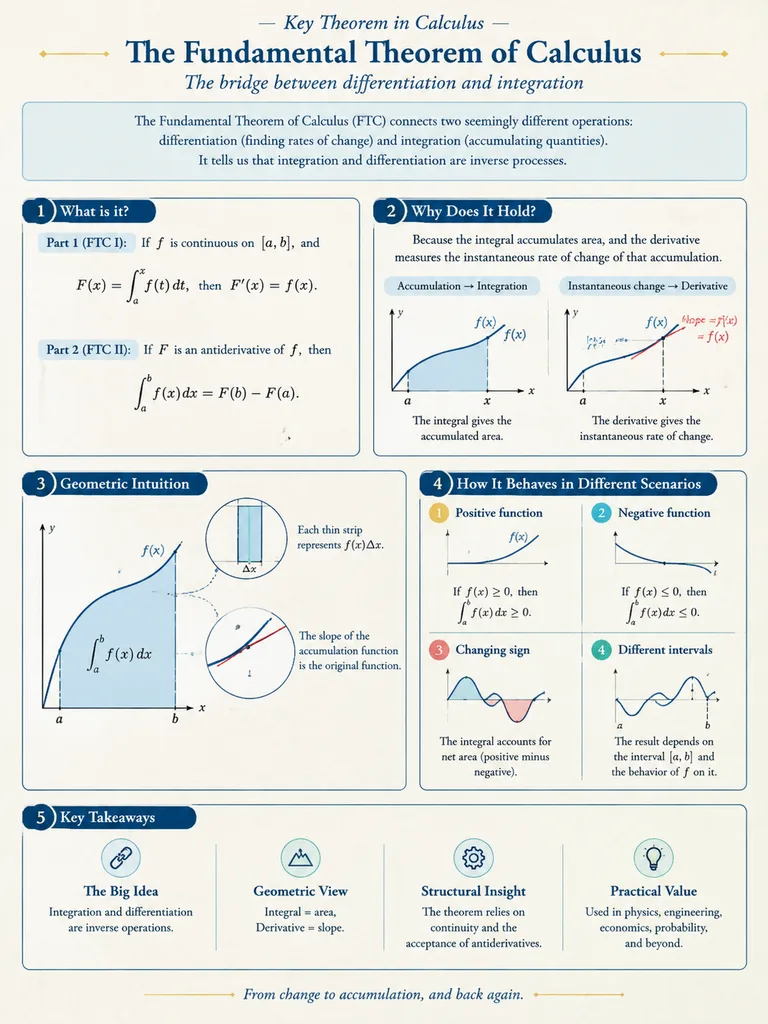
Mathematisches Visualisierungs-Infografik-Poster
Erstellt eine akademische Infografik im Posterstil, die mathematische Themen mit klaren Diagrammen erklärt. Passe das Thema in Klammern und die Ausrichtung flexibel an.
Prompt
A mathematical visualization infographic explaining [mathematical concepts/knowledge points], designed to intuitively convey what it is, why it holds true, its geometric and structural intuition, and how it behaves across different scenarios. Styled as a high-quality academic lecture handout combined with a hand-drawn educational poster: elegant, clear, and informative without visual clutter. Layout: [vertical layout] on a clean light-colored paper texture background. Features dark blue headings, black and dark gray line art, accented with touches of cobalt blue, turquoise, gold, and muted red. Includes rounded-corner informational cards, thin borders, numbered labels, hand-drawn indicator arrows, circular magnification insets, and summary columns. Balanced, aesthetic, and rigorous academic illustration.
Was Sie anpassen können
Ersetzen Sie diese Teile des Prompts vor dem Generieren durch Ihr eigenes Motiv oder Ihren eigenen Text.
[mathematical concepts/knowledge points]Platzhalter[vertical layout]Platzhalter
Prompt-Details
- Kategorie
- Infografik / Bildung
- Modell
- GPT IMAGE 2
- Kosten pro Bild
- 1K: 43 Credits · 2K: 86 Credits · 4K: 143 Credits
- Seitenverhältnis
- 3:4
- Hinzugefügt