
Infografik / Bildung
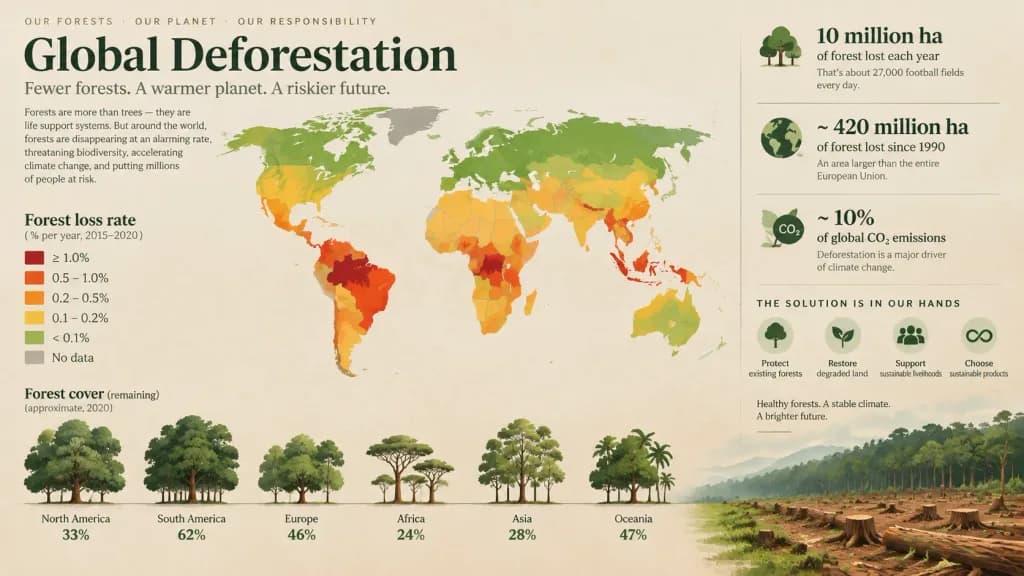
Redaktionelle Datenvisualisierung zur Entwaldung
Erzeugt eine wirkungsvolle redaktionelle Infografik zum weltweiten Waldverlust. Passen Sie Thema und Grafikelemente in den Klammern für andere Daten an.
datenvisualisierunginfografikeditorial-designentwaldungumweltweltkartegrafikdesign
Ähnliche Prompts durchstöbernInfografiken AI-PromptsEditorial-Design AI-PromptsGrafikdesign AI-Prompts
Quelle:Jared Liu
Prompt
An informative, impactful editorial data visualization for a report on [global deforestation]. The central visual features [a stylized world map color-coded by rates of forest loss, accompanied by minimalist tree graphics where foliage density indicates remaining forest cover]. Clean graphic design layout, elegant typography, emotionally resonant storytelling, modern infographic aesthetic with a natural earth-tone palette contrasted with warning accent colors.
Was Sie anpassen können
Ersetzen Sie diese Teile des Prompts vor dem Generieren durch Ihr eigenes Motiv oder Ihren eigenen Text.
[global deforestation]Platzhalter
Prompt-Details
- Kategorie
- Infografik / Bildung
- Modell
- Seedream 4.5
- Kosten pro Bild
- 33 Credits (2K–4K)
- Seitenverhältnis
- 16:9
- Ersteller
- Jared Liu
- Lizenz
- CC BY 4.0
- Hinzugefügt