
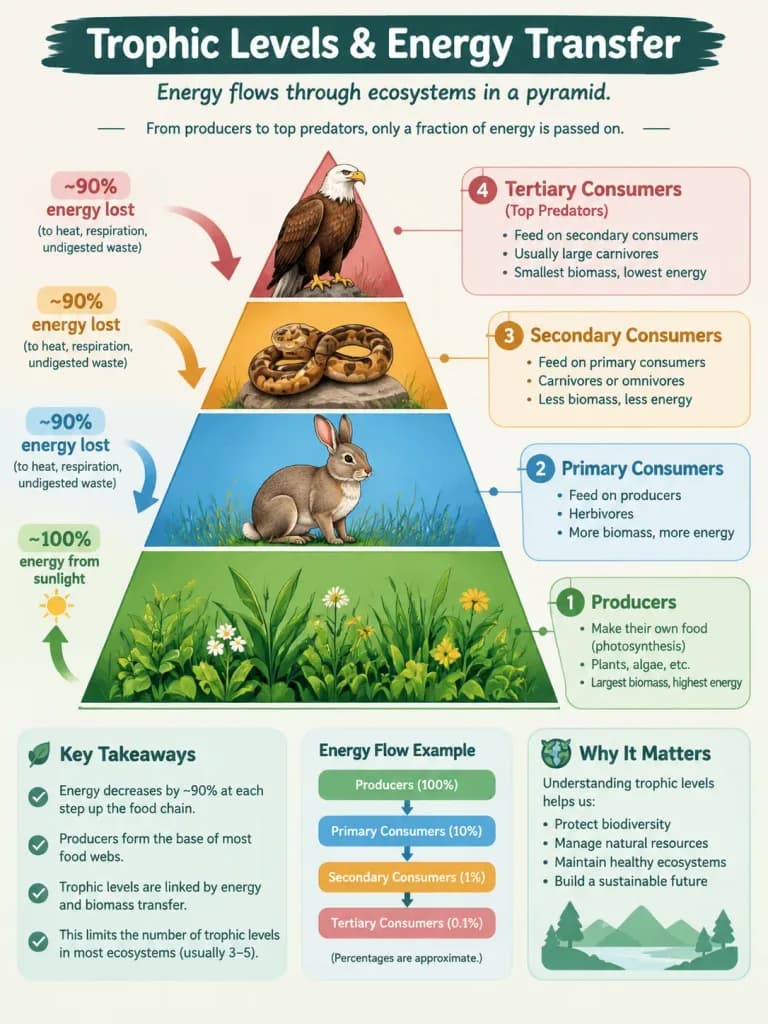
Infografik zu Trophieebenen im Ökosystem
Erstellt eine lehrreiche Infografik zur ökologischen Pyramide und dem Energietransfer. Ändern Sie die Zielgruppe, um Komplexität und Stil anzupassen.
Prompt
A detailed educational infographic designed for [college students] illustrating trophic levels and energy transfer in ecosystems. The composition centers on a tiered ecological pyramid showing energy and biomass flow, complete with labeled sections and concise definitions for producers, primary consumers, secondary consumers, and tertiary consumers. Clean modern vector graphic style, crisp typography, clear arrows showing percentage of energy loss between levels, balanced layout, scientific illustration aesthetics.
Was Sie anpassen können
Ersetzen Sie diese Teile des Prompts vor dem Generieren durch Ihr eigenes Motiv oder Ihren eigenen Text.
[college students]Platzhalter
Prompt-Details
- Kategorie
- Infografik / Bildung
- Modell
- GPT IMAGE 2.5 Sunburst
- Kosten pro Bild
- 1K: 11 Credits · 2K: 22 Credits · 4K: 36 Credits
- Seitenverhältnis
- 3:4
- Hinzugefügt