
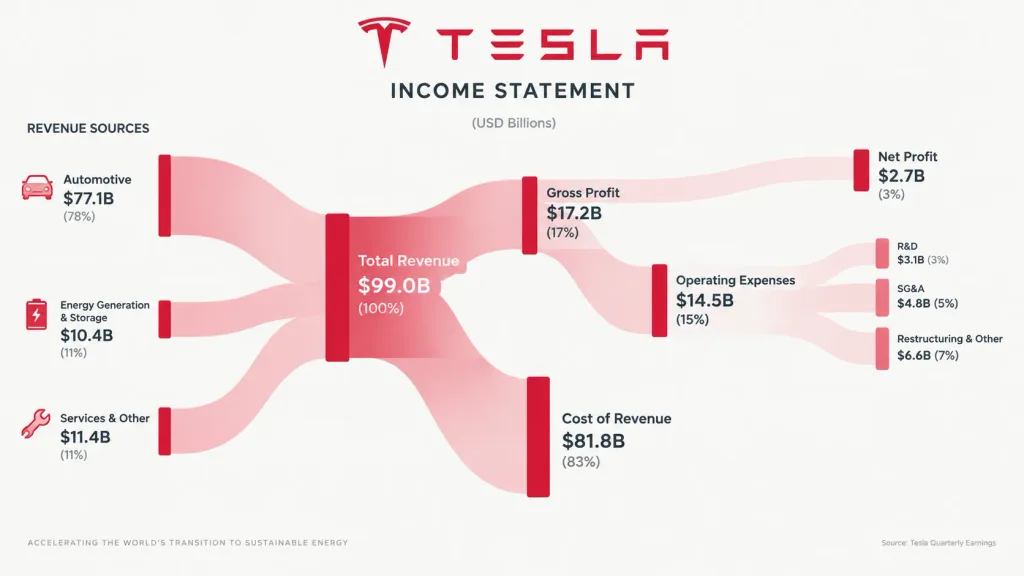
Finanzielles Sankey-Diagramm für Unternehmen
Erstellen Sie ein elegantes Sankey-Diagramm zur Visualisierung von Gewinn- und Verlustrechnungen. Passen Sie Markenname und Akzentfarbe flexibel an.
Prompt
A professional financial Sankey diagram visualizing the Income Statement of [Tesla], in the style of App Economy Insights and corporate financial reports. Visual Style: High-fidelity vector infographic, clean minimalist aesthetic, flat design on a very light grey or off-white background. Color Scheme: Primary brand color [crimson red] as the dominant theme for main revenue flows and profit blocks, with saturated vertical node bars and semi-transparent, lighter-opacity gradient flowing ribbons for a cohesive palette. Composition: Horizontal flow from Left (Revenue Sources) to Right (Net Profit). Connecting paths feature silky smooth Bezier curves resembling liquid ribbons. Minimalist flat vector icons on the left represent business segments (automotive, energy, services). The official brand logo is centered at the top. Details: Crisp sans-serif typography, structured data visualization layout clearly separating Revenue, Gross Profit, Operating Expenses, and Net Profit.
Was Sie anpassen können
Ersetzen Sie diese Teile des Prompts vor dem Generieren durch Ihr eigenes Motiv oder Ihren eigenen Text.
[Tesla]Platzhalter[crimson red]Platzhalter
Prompt-Details
- Kategorie
- Infografik / Bildung
- Modell
- Nano Banana Pro
- Kosten pro Bild
- 1K: 108 Credits · 2K: 108 Credits · 4K: 193 Credits
- Seitenverhältnis
- 16:9
- Lizenz
- MIT
- Hinzugefügt