
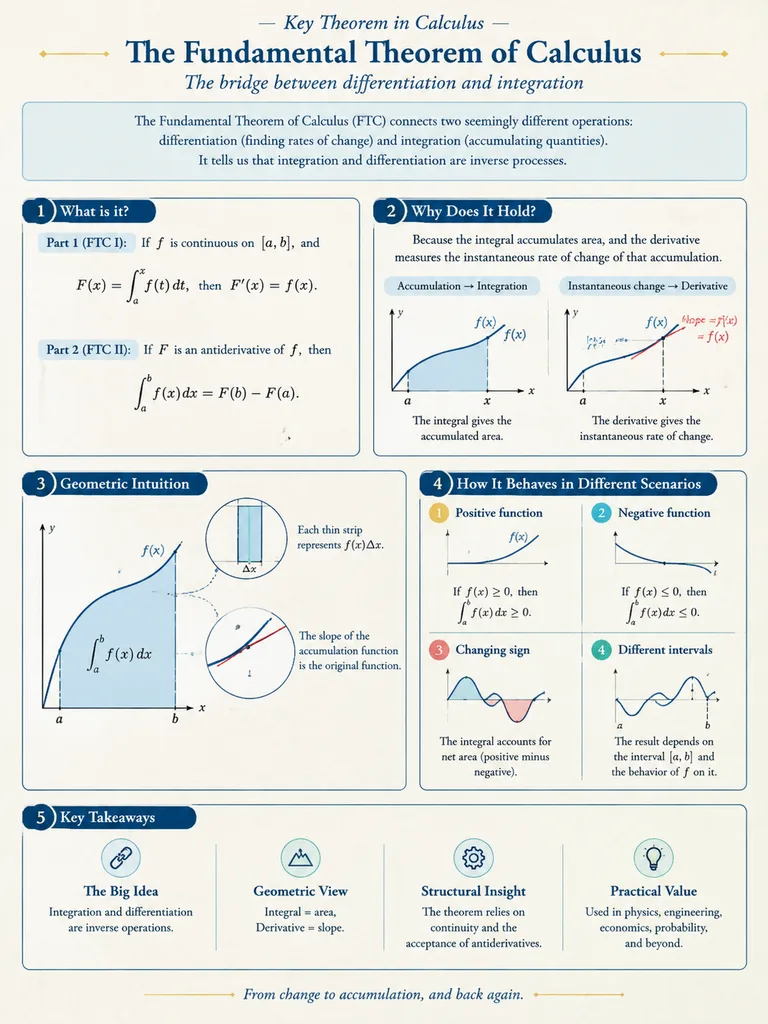
โปสเตอร์อินโฟกราฟิกภาพประกอบทางคณิตศาสตร์
สร้างอินโฟกราฟิกสไตล์โปสเตอร์วิชาการที่อธิบายเนื้อหาคณิตศาสตร์ด้วยแผนภาพที่ชัดเจน ปรับแต่งหัวข้อในวงเล็บและทิศทางการจัดวางได้ตามต้องการ
พรอมป์
A mathematical visualization infographic explaining [mathematical concepts/knowledge points], designed to intuitively convey what it is, why it holds true, its geometric and structural intuition, and how it behaves across different scenarios. Styled as a high-quality academic lecture handout combined with a hand-drawn educational poster: elegant, clear, and informative without visual clutter. Layout: [vertical layout] on a clean light-colored paper texture background. Features dark blue headings, black and dark gray line art, accented with touches of cobalt blue, turquoise, gold, and muted red. Includes rounded-corner informational cards, thin borders, numbered labels, hand-drawn indicator arrows, circular magnification insets, and summary columns. Balanced, aesthetic, and rigorous academic illustration.
ส่วนที่ปรับแต่งได้
ก่อนสร้างภาพ ให้แทนที่ส่วนเหล่านี้ของพรอมป์ด้วยหัวข้อหรือข้อความของคุณเอง
[mathematical concepts/knowledge points]ตัวแทนข้อความ[vertical layout]ตัวแทนข้อความ
รายละเอียดพรอมป์
- หมวดหมู่
- อินโฟกราฟิก / การศึกษา
- โมเดล
- GPT IMAGE 2
- ค่าใช้จ่ายต่อภาพ
- 1K: 43 เครดิต · 2K: 86 เครดิต · 4K: 143 เครดิต
- อัตราส่วนภาพ
- 3:4
- วันที่เพิ่ม