
อินโฟกราฟิก / การศึกษา
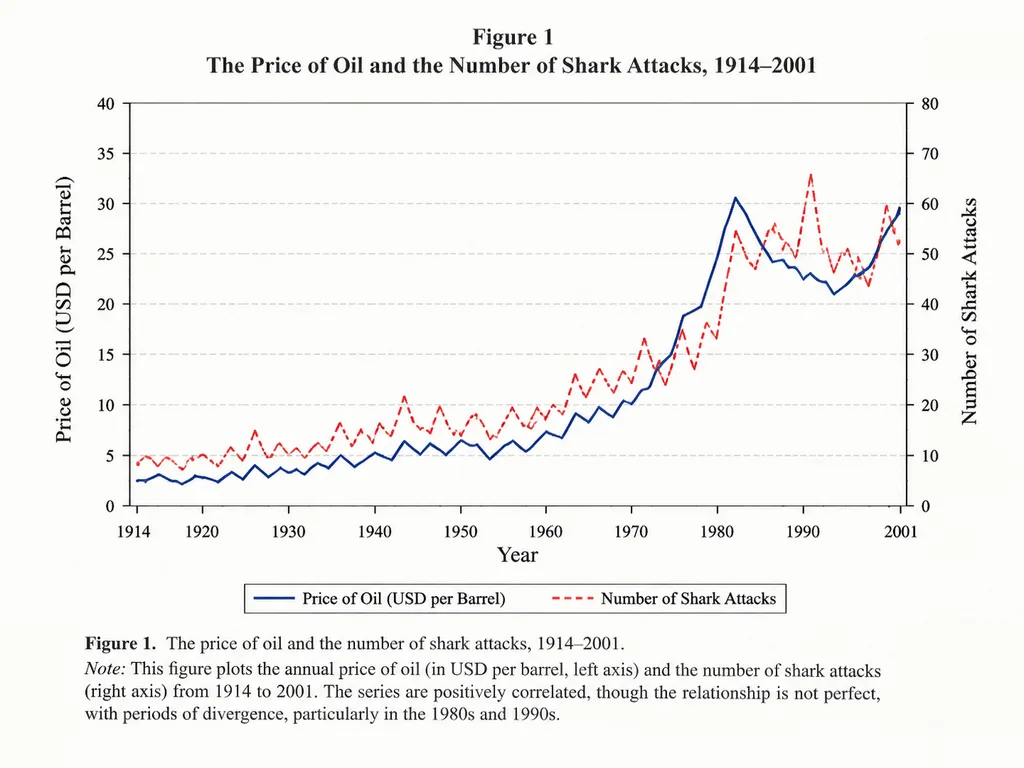
กราฟเส้นแสดงความสัมพันธ์เชิงวิชาการ
สร้างกราฟสไตล์วารสารวิชาการเปรียบเทียบสองตัวแปรตามเวลา ปรับเปลี่ยนสาขาวิชา ตัวแปร และช่วงเวลาเพื่อสร้างกราฟตามต้องการ
กราฟเส้นแผนภูมิอินโฟกราฟิกบทความวิชาการเศรษฐศาสตร์การแสดงข้อมูลด้วยภาพ
ดูพรอมต์ที่คล้ายกันพรอมต์ AI อินโฟกราฟิก
พรอมป์
An academic line graph figure from a prestigious [economics paper], demonstrating a close but imperfect correlation between [the price of oil] and [the number of shark attacks] across [the years 1914 to 2001]. The chart features clean dual y-axes, distinct trend lines, labeled axes, a neat legend, subtle grid lines, traditional serif academic typography, and a formal figure caption at the bottom, styled like a scan of a printed scholarly journal.
ส่วนที่ปรับแต่งได้
ก่อนสร้างภาพ ให้แทนที่ส่วนเหล่านี้ของพรอมป์ด้วยหัวข้อหรือข้อความของคุณเอง
[economics paper]ตัวแทนข้อความ[the price of oil]ตัวแทนข้อความ[the number of shark attacks]ตัวแทนข้อความ[the years 1914 to 2001]ตัวแทนข้อความ
รายละเอียดพรอมป์
- หมวดหมู่
- อินโฟกราฟิก / การศึกษา
- โมเดล
- GPT IMAGE 2
- ค่าใช้จ่ายต่อภาพ
- 1K: 43 เครดิต · 2K: 86 เครดิต · 4K: 143 เครดิต
- อัตราส่วนภาพ
- 4:3
- วันที่เพิ่ม