
Infografika / Edukacja
Wizualizacja Danych Redakcyjnych o Wylesianiu
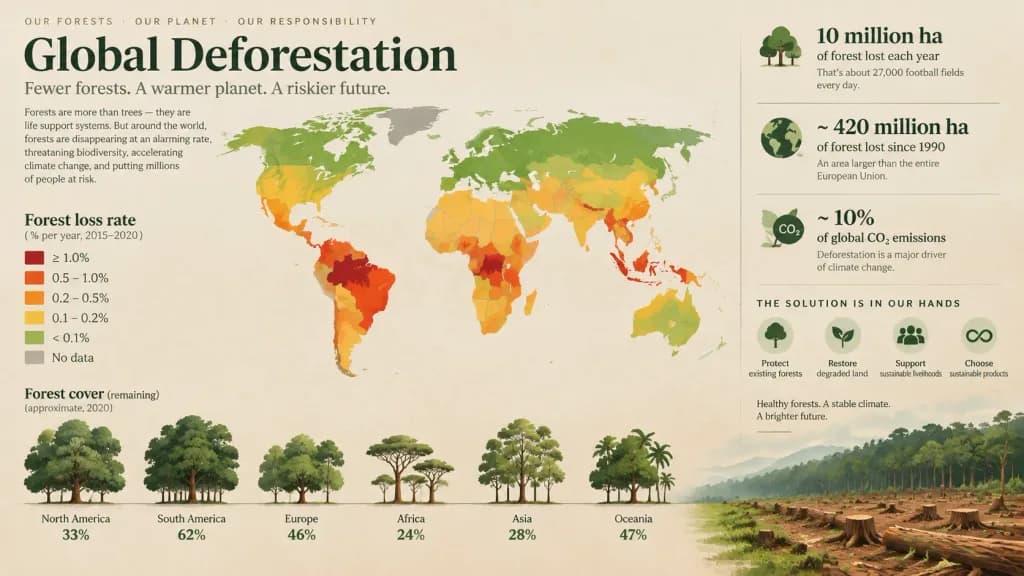
Generuje sugestywną infografikę redakcyjną poświęconą globalnej utracie lasów. Dostosuj temat i elementy w nawiasach do innych danych ekologicznych.
wizualizacja-danychinfografikaprojektowanie-redakcyjnewylesianieśrodowiskomapa-światagrafika
Przeglądaj podobne promptyInfografiki – prompty AIGrafika wydawnicza – prompty AIProjektowanie graficzne – prompty AI
Źródło:Jared Liu
Prompt
An informative, impactful editorial data visualization for a report on [global deforestation]. The central visual features [a stylized world map color-coded by rates of forest loss, accompanied by minimalist tree graphics where foliage density indicates remaining forest cover]. Clean graphic design layout, elegant typography, emotionally resonant storytelling, modern infographic aesthetic with a natural earth-tone palette contrasted with warning accent colors.
Co możesz dostosować
Przed generowaniem zamień te części promptu na własny temat lub tekst.
[global deforestation]symbol zastępczy
Szczegóły promptu
- Kategoria
- Infografika / Edukacja
- Model
- Seedream 4.5
- Koszt za obraz
- 33 kredytów (2K–4K)
- Proporcje
- 16:9
- Autor
- Jared Liu
- Licencja
- CC BY 4.0
- Dodano