
Infografika / Edukacja
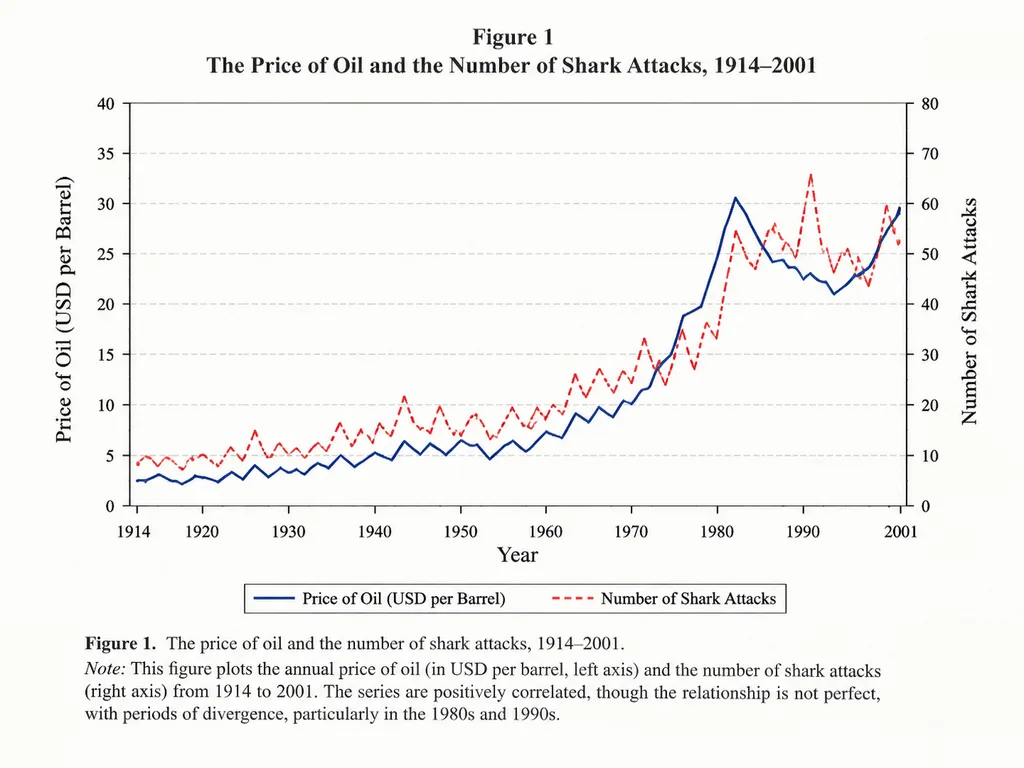
Akademicki Wykres Liniowy Korelacji
Generuje autentyczny wykres w stylu artykułu naukowego porównujący dwie zmienne w czasie. Zmień dziedzinę, zmienne i okres, aby go dostosować.
wykres liniowywykresinfografikaartykuł naukowyekonomiawizualizacja danych
Przeglądaj podobne promptyInfografiki – prompty AI
Prompt
An academic line graph figure from a prestigious [economics paper], demonstrating a close but imperfect correlation between [the price of oil] and [the number of shark attacks] across [the years 1914 to 2001]. The chart features clean dual y-axes, distinct trend lines, labeled axes, a neat legend, subtle grid lines, traditional serif academic typography, and a formal figure caption at the bottom, styled like a scan of a printed scholarly journal.
Co możesz dostosować
Przed generowaniem zamień te części promptu na własny temat lub tekst.
[economics paper]symbol zastępczy[the price of oil]symbol zastępczy[the number of shark attacks]symbol zastępczy[the years 1914 to 2001]symbol zastępczy
Szczegóły promptu
- Kategoria
- Infografika / Edukacja
- Model
- GPT IMAGE 2
- Koszt za obraz
- 1K: 43 kredytów · 2K: 86 kredytów · 4K: 143 kredytów
- Proporcje
- 4:3
- Dodano