
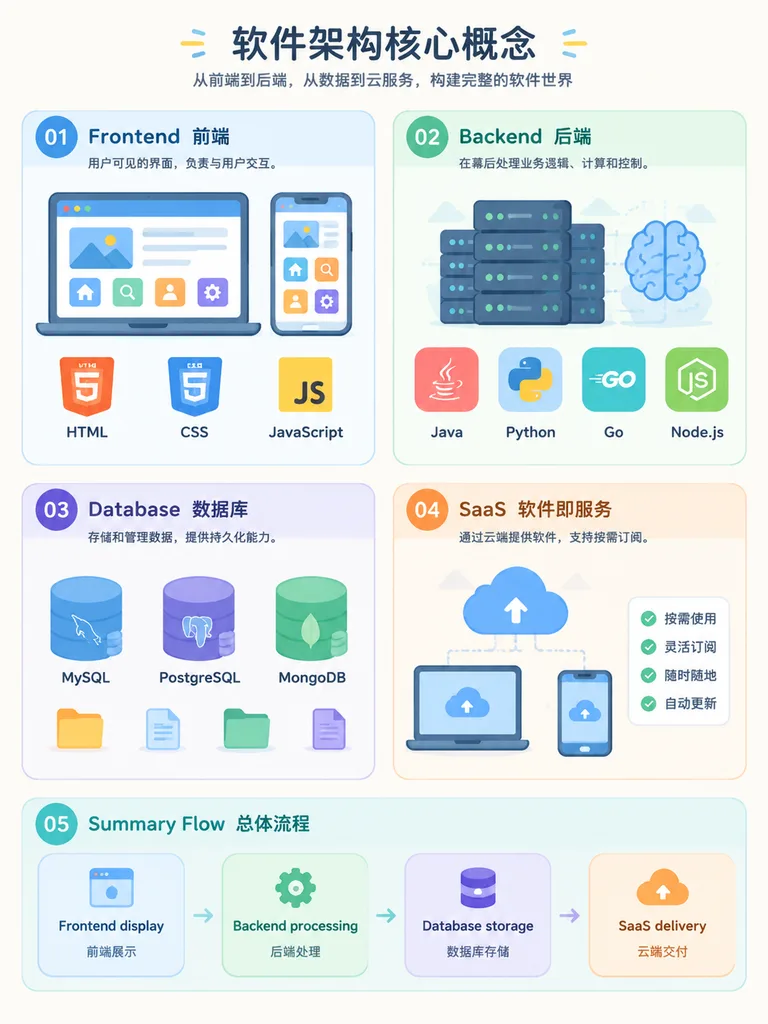
소프트웨어 아키텍처 개념 인포그래픽
프론트엔드, 백엔드, 데이터베이스, SaaS의 흐름을 직관적으로 설명하는 인포그래픽입니다. 모듈 제목과 기술 스택을 자유롭게 변경할 수 있습니다.
프롬프트
An easy-to-understand educational infographic diagram explaining core software architecture concepts in an organized layout: - Section 01: [Frontend] - The user-visible interface, showing web browser and smartphone screens with icons for HTML, CSS, and JavaScript. - Section 02: [Backend] - The logic and calculation layer behind the scenes, featuring server racks and brain icons with tags for Java, Python, Go, and Node.js. - Section 03: [Database] - Data storage and memory, illustrated with relational table cylinders and document folder icons representing MySQL, PostgreSQL, and MongoDB. - Section 04: [SaaS] - Software as a Service, depicting cloud delivery and subscription models across desktop and mobile devices. - Section 05: [Summary Flow] - A horizontal connecting flowchart showing: [Frontend display → Backend processing → Database storage → SaaS delivery]. Style: Modern flat vector infographic, clean layout, pastel color-coded modules, minimalist tech icons, clear readable labels, on a soft off-white background.
바꿔 쓸 수 있는 부분
생성하기 전에 프롬프트의 이 부분을 원하는 주제나 문구로 바꿔 보세요.
[Frontend]자리 표시자[Backend]자리 표시자[Database]자리 표시자[SaaS]자리 표시자[Summary Flow]자리 표시자
프롬프트 정보
- 카테고리
- 인포그래픽 / 교육
- 모델
- GPT IMAGE 2
- 이미지당 비용
- 1K: 43 크레딧 · 2K: 86 크레딧 · 4K: 143 크레딧
- 화면 비율
- 3:4
- 추가일