
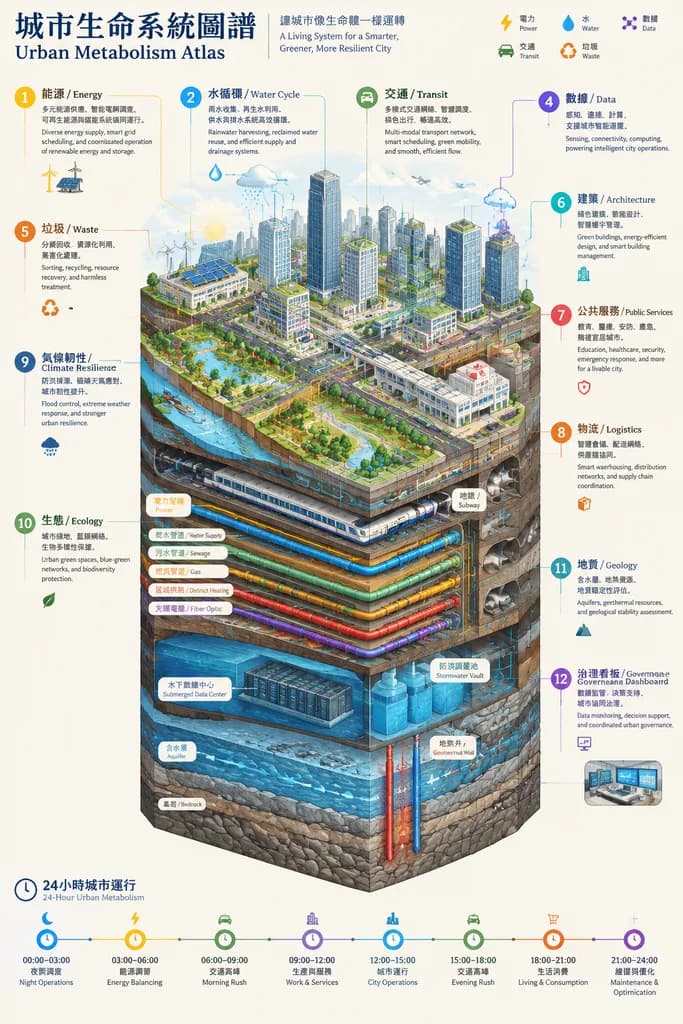
스마트 시티 메타볼리즘 단면 인포그래픽
초고층 빌딩부터 지하 암반층까지의 도시 인프라를 상세히 보여주는 아이소메트릭 단면도를 생성합니다. 라벨과 색상 테마를 자유롭게 변경할 수 있습니다.
프롬프트
Vertical isometric cutaway infographic poster titled "城市生命系统图谱 / Urban Metabolism Atlas", illustrating a comprehensive smart city cross-section from open sky to deep bedrock. Above ground features skyscrapers, streets, and green spaces; underground layers reveal subway networks, utility tunnels, water, sewage, gas, and district heating pipelines, fiber optic cables, submerged data centers, stormwater flood retention vaults, natural aquifers, geothermal wells, and geological bedrock strata. Clear color-coded circulatory flows represent power, water, digital data, vehicle traffic, and waste management. Includes 12 numbered bilingual (CN/EN) callout panels: 能源/Energy, 水循环/Water Cycle, 交通/Transit, 数据/Data, 垃圾/Waste, 建筑/Architecture, 公共服务/Public Services, 物流/Logistics, 气候韧性/Climate Resilience, 生态/Ecology, 地质/Geology, and 治理看板/Governance Dashboard. A continuous 24-hour timeline diagram runs along the bottom. Style of a high-end engineering white paper and scientific atlas, clean off-white paper background, razor-sharp technical linework, clear data visualization, no cyberpunk tropes.
바꿔 쓸 수 있는 부분
생성하기 전에 프롬프트의 이 부분을 원하는 주제나 문구로 바꿔 보세요.
“城市生命系统图谱 / Urban Metabolism Atlas”따옴표 안 문구
프롬프트 정보
- 카테고리
- 인포그래픽 / 교육
- 모델
- GPT IMAGE 2
- 이미지당 비용
- 1K: 43 크레딧 · 2K: 86 크레딧 · 4K: 143 크레딧
- 화면 비율
- 9:16
- 라이선스
- MIT
- 추가일