
인포그래픽 / 교육
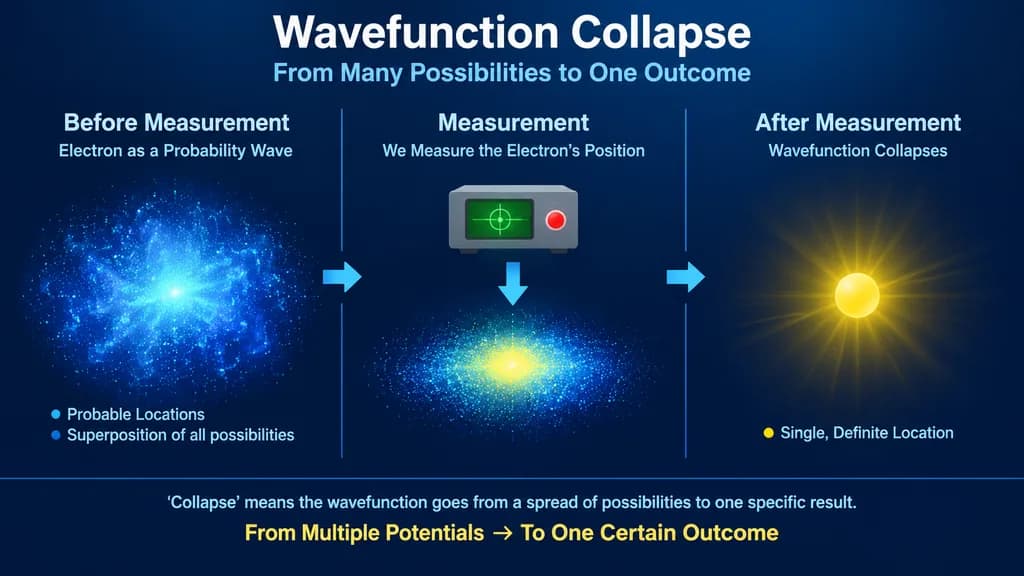
양자 파동함수 붕괴 과학 인포그래픽
양자 파동함수 붕괴 과정을 3단계로 명확히 설명하는 과학 인포그래픽을 생성합니다. 대괄호 안의 제목과 대상을 변경해 다른 다단계 개념에도 적용할 수 있습니다.
인포그래픽양자물리학파동함수과학일러스트교육다이어그램
유사한 프롬프트 둘러보기인포그래픽 AI 프롬프트
프롬프트
{
  "type": "educational infographic",
  "style": "clean, modern, scientific illustration",
  "background": "dark blue gradient",
  "header": {
    "title": "[Wavefunction Collapse]",
    "subtitle": "From Many Possibilities to One Outcome"
  },
  "layout": {
    "structure": "3 columns separated by thin vertical lines, connected by 2 horizontal right-pointing arrows",
    "sections": [
      {
        "heading": "[Before Measurement]",
        "subheading": "[Electron] as a Probability Wave",
        "visual": "diffuse, glowing blue cloud of particles resembling a nebula",
        "labels": [
          "Probable Locations",
          "Superposition of all possibilities"
        ]
      },
      {
        "heading": "[Measurement]",
        "subheading": "We Measure the [Electron]'s Position",
        "visual": "grey rectangular measuring device with a green screen and red button, with a downward arrow pointing to a flattened, glowing blue and yellow particle cloud"
      },
      {
        "heading": "[After Measurement]",
        "subheading": "Wavefunction Collapses",
        "visual": "single, solid yellow sphere emitting radial light rays",
        "labels": [
          "Single, Definite Location"
        ]
      }
    ]
  },
  "footer": {
    "explanation": "'Collapse' means the wavefunction goes from a spread of possibilities to one specific result.",
    "summary": "From Multiple Potentials → To One Certain Outcome"
  }
}바꿔 쓸 수 있는 부분
생성하기 전에 프롬프트의 이 부분을 원하는 주제나 문구로 바꿔 보세요.
[Wavefunction Collapse]자리 표시자[Before Measurement]자리 표시자[Electron]자리 표시자[Measurement]자리 표시자[After Measurement]자리 표시자
프롬프트 정보
- 카테고리
- 인포그래픽 / 교육
- 모델
- GPT IMAGE 2
- 이미지당 비용
- 1K: 43 크레딧 · 2K: 86 크레딧 · 4K: 143 크레딧
- 화면 비율
- 16:9
- 추가일