
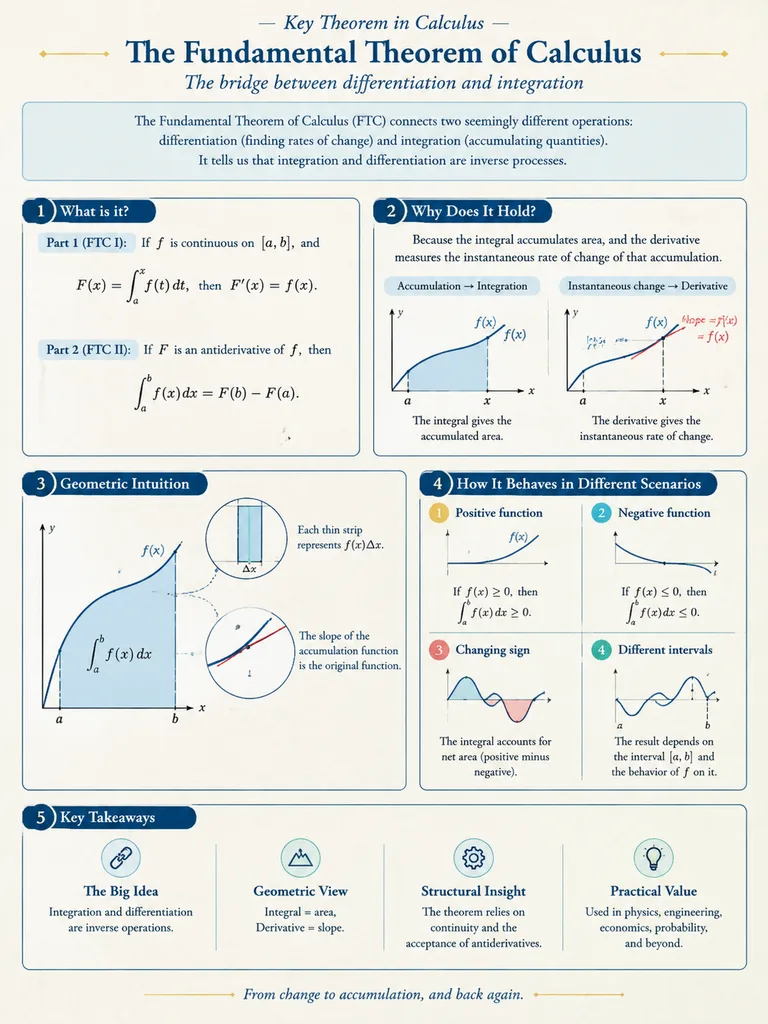
수학 시각화 인포그래픽 포스터
복잡한 수학 개념을 명확한 도표로 설명하는 학술 스타일 인포그래픽 포스터를 생성합니다. 대괄호 안의 주제와 레이아웃 방향을 변경해 적용하세요.
프롬프트
A mathematical visualization infographic explaining [mathematical concepts/knowledge points], designed to intuitively convey what it is, why it holds true, its geometric and structural intuition, and how it behaves across different scenarios. Styled as a high-quality academic lecture handout combined with a hand-drawn educational poster: elegant, clear, and informative without visual clutter. Layout: [vertical layout] on a clean light-colored paper texture background. Features dark blue headings, black and dark gray line art, accented with touches of cobalt blue, turquoise, gold, and muted red. Includes rounded-corner informational cards, thin borders, numbered labels, hand-drawn indicator arrows, circular magnification insets, and summary columns. Balanced, aesthetic, and rigorous academic illustration.
바꿔 쓸 수 있는 부분
생성하기 전에 프롬프트의 이 부분을 원하는 주제나 문구로 바꿔 보세요.
[mathematical concepts/knowledge points]자리 표시자[vertical layout]자리 표시자
프롬프트 정보
- 카테고리
- 인포그래픽 / 교육
- 모델
- GPT IMAGE 2
- 이미지당 비용
- 1K: 43 크레딧 · 2K: 86 크레딧 · 4K: 143 크레딧
- 화면 비율
- 3:4
- 추가일