
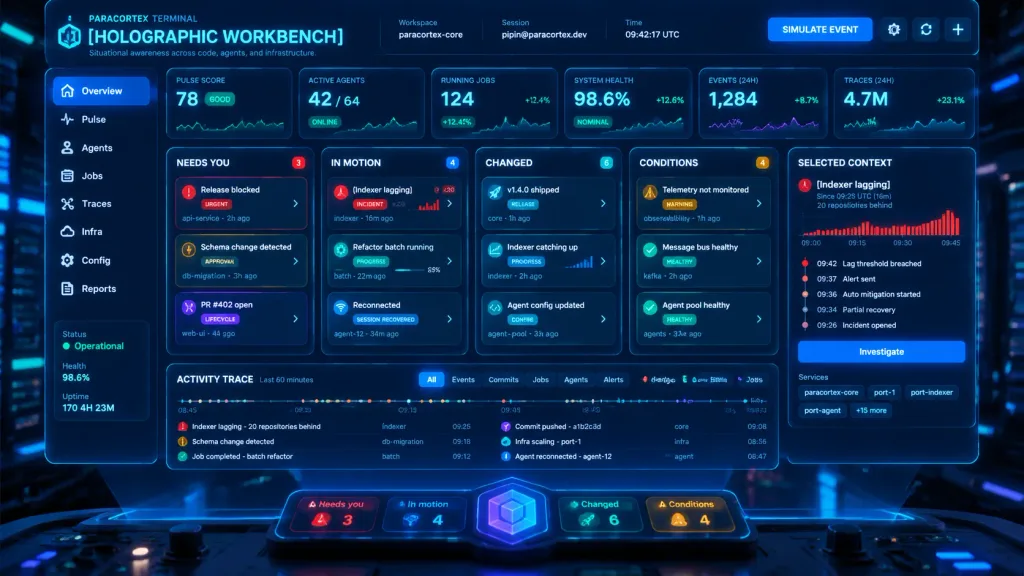
홀로그래픽 SF 관제 센터 대시보드
사이버펑크 지휘 본부의 다크 글래스모피즘 홀로그램 관제 화면을 생성합니다. 메인 제목과 인시던트 내용을 변경하여 맞춤 설정할 수 있습니다.
프롬프트
Cinematic sci-fi product mockup of a futuristic operations dashboard titled "[HOLOGRAPHIC WORKBENCH]", floating as a transparent neon-blue holographic screen above a dark control desk in a cyberpunk command center. Wide 16:9 landscape interface, dark navy and black glassmorphism UI, glowing cyan borders, subtle scanlines, faint grid texture, shallow depth of field with blurred server rack lights in the background. Translucent dark glass panels with rounded corners, subtle reflections on the desk, physical console knobs at the bottom edge, atmospheric blue light beams. Header: Top-left text reads "PARACORTEX TERMINAL" above the main title "[HOLOGRAPHIC WORKBENCH]" and subtitle "Situational awareness across code, agents, and infrastructure." Top-center metadata displays 3 fields: Workspace "paracortex-core", Session "pipin@paracortex.dev", Time "09:42:17 UTC". Top-right contains a "SIMULATE EVENT" button alongside small gear, sync, and plus icons. Left Sidebar & Status: Vertical glowing sidebar with 8 navigation items: Overview, Pulse, Agents, Jobs, Traces, Infra, Config, Reports. Lower left status panel shows Status "Operational", Health "98.6%", Uptime "170 4H 23M". Top Metric Row: Exactly 6 stat cards across the top: 1. "PULSE SCORE" value "78" status "GOOD" with sparkline graph 2. "ACTIVE AGENTS" value "42 / 64" status "ONLINE" 3. "RUNNING JOBS" value "124" status "+12.4%" 4. "SYSTEM HEALTH" value "98.6%" status "NOMINAL" 5. "EVENTS (24H)" value "1,284" status "+8.7%" 6. "TRACES (24H)" value "4.7M" status "+23.1%" Main Layout: 5 vertical columns beneath metrics: - Column 1 "NEEDS YOU" (badge 3): 3 task cards: "Release blocked" (urgent red), "Schema change detected" (amber approval), "PR #402 open" (purple lifecycle). - Column 2 "IN MOTION" (badge 4): 3 task cards: "[Indexer lagging]" (red incident, x20 badge, tiny bar chart), "Refactor batch running" (teal progress bar), "Reconnected" (blue session recovered). - Column 3 "CHANGED" (badge 6): 3 task cards: "v1.4.0 shipped", "Indexer catching up" (mini bar chart), "Agent config updated". - Column 4 "CONDITIONS" (badge 4): 3 task cards: "Telemetry not monitored", "Message bus healthy", "Agent pool healthy". - Column 5 "SELECTED CONTEXT" details panel focused on "[Indexer lagging]": subtext "Since 09:25 UTC (16m)" and "20 repositories behind", red bar chart labeled 09:00, 09:15, 09:30, 09:45, a 5-step vertical timeline ("09:42 Lag threshold breached", "09:37 Alert sent", "09:36 Auto mitigation started", "09:34 Partial recovery", "09:26 Incident opened"), "Investigate" button, and service chips ("paracortex-core", "port-1", "port-indexer", "port-agent", "+15 more"). Bottom Activity Area: Wide "ACTIVITY TRACE" panel labeled "Last 60 minutes" with multicolored timeline dots, 6 filter tabs ("All", "Events", "Commits", "Jobs", "Agents", "Alerts"), compact event list, and legend with 6 categories (Alerts, Changes, Jobs, Commits, Infra, Info). Foreground Dock: Floating rounded glass dock at bottom center with 4 counters: "Needs you 3" (red), "In motion 4" (blue), "Changed 6" (teal), "Conditions 4" (amber), centered around a glowing purple-blue cube orb emblem. Style & Constraints: Dense, highly legible technical typography, color-coded status elements, premium sci-fi SaaS software aesthetic. No people visible.
바꿔 쓸 수 있는 부분
생성하기 전에 프롬프트의 이 부분을 원하는 주제나 문구로 바꿔 보세요.
[HOLOGRAPHIC WORKBENCH]자리 표시자[Indexer lagging]자리 표시자“PARACORTEX TERMINAL”따옴표 안 문구“Situational awareness across code, agents, and infrastructure.”따옴표 안 문구“paracortex-core”따옴표 안 문구“pipin@paracortex.dev”따옴표 안 문구“09:42:17 UTC”따옴표 안 문구“SIMULATE EVENT”따옴표 안 문구
프롬프트 정보
- 카테고리
- UI / UX 디자인
- 모델
- GPT IMAGE 2
- 이미지당 비용
- 1K: 43 크레딧 · 2K: 86 크레딧 · 4K: 143 크레딧
- 화면 비율
- 16:9
- 추가일