
인포그래픽 / 교육
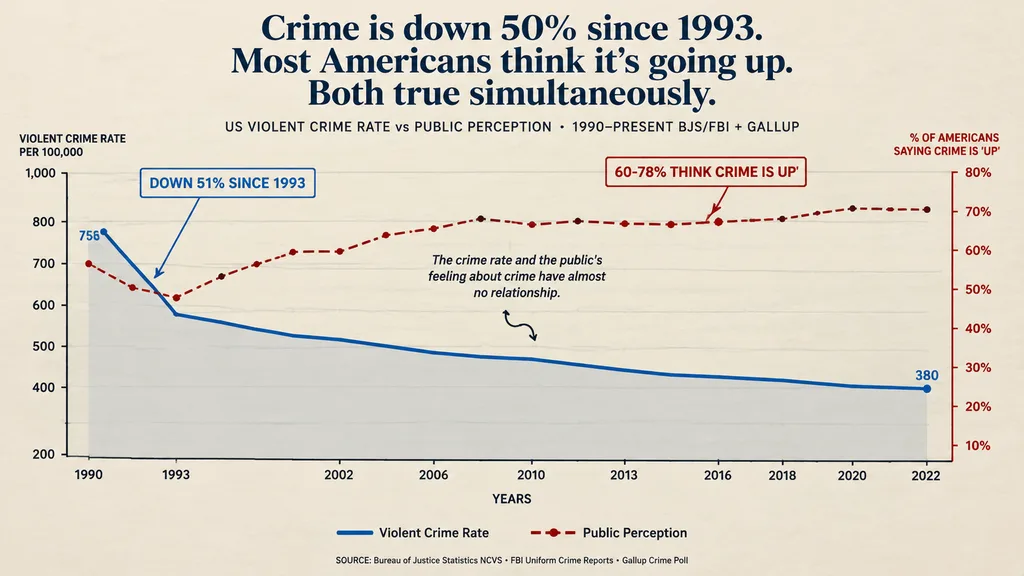
저널리즘 스타일 이중 축 꺾은선형 인포그래픽
시간에 따른 상반된 두 가지 추세를 대조하는 세련된 저널리즘 인포그래픽을 만듭니다. 헤드라인과 축 레이블을 수정하여 나만의 데이터를 표현하세요.
인포그래픽데이터시각화차트에디토리얼저널리즘꺾은선그래프
프롬프트
{
  "type": "dual-axis line chart infographic",
  "style": "editorial data visualization, matte paper texture background, clean journalistic design",
  "typography": {
    "headline": "serif font, bold, centered",
    "labels": "sans-serif, clean, uppercase and sentence case mix"
  },
  "layout": {
    "header": {
      "main_title": "[Crime is down 50% since 1993. Most Americans think it's going up. Both true simultaneously.]",
      "subtitle": "US VIOLENT CRIME RATE vs PUBLIC PERCEPTION • 1990–PRESENT BJS/FBI + GALLUP"
    },
    "chart_area": {
      "background": "light beige with faint horizontal grid lines",
      "axes": {
        "x_axis": {
          "label": "Years",
          "ticks": [
            "1990",
            "1993",
            "2002",
            "2006",
            "2010",
            "2013",
            "2016",
            "2018",
            "2020",
            "2022"
          ]
        },
        "y_axis_left": {
          "label": "[Violent Crime Rate Per 100,000]",
          "scale": [
            "200",
            "400",
            "500",
            "600",
            "700",
            "800",
            "1000"
          ],
          "color": "black"
        },
        "y_axis_right": {
          "label": "[% of Americans Saying Crime Is 'Up']",
          "scale": [
            "10%",
            "20%",
            "30%",
            "40%",
            "50%",
            "60%",
            "70%",
            "80%"
          ],
          "color": "dark red"
        }
      },
      "data_series": [
        {
          "name": "Violent Crime Rate",
          "style": "thick solid blue line with light grey shading underneath",
          "trend": "starts high, drops sharply, then steadily declines",
          "data_labels": [
            "758",
            "380"
          ]
        },
        {
          "name": "Public Perception",
          "style": "dashed dark red line with small circle markers",
          "trend": "fluctuates but generally trends upwards, staying high"
        }
      ],
      "annotations": [
        {
          "text": "[DOWN 51% SINCE 1993]",
          "style": "callout box with pointer, blue text",
          "position": "top left, pointing to the blue line drop"
        },
        {
          "text": "[60-78% THINK CRIME IS UP]",
          "style": "callout box with pointer, red text",
          "position": "mid right, pointing to the dashed red line"
        },
        {
          "text": "[The crime rate and the public's feeling about crime have almost no relationship.]",
          "style": "floating insight text with a small squiggly arrow",
          "position": "center, between the two lines"
        }
      ]
    },
    "footer": {
      "source_text": "SOURCE: Bureau of Justice Statistics NCVS • FBI Uniform Crime Reports • Gallup Crime Poll"
    }
  }
}바꿔 쓸 수 있는 부분
생성하기 전에 프롬프트의 이 부분을 원하는 주제나 문구로 바꿔 보세요.
[Violent Crime Rate Per 100,000]자리 표시자[% of Americans Saying Crime Is 'Up']자리 표시자[DOWN 51% SINCE 1993]자리 표시자[60-78% THINK CRIME IS UP]자리 표시자
프롬프트 정보
- 카테고리
- 인포그래픽 / 교육
- 모델
- GPT IMAGE 2
- 이미지당 비용
- 1K: 43 크레딧 · 2K: 86 크레딧 · 4K: 143 크레딧
- 화면 비율
- 16:9
- 추가일