
인포그래픽 / 교육
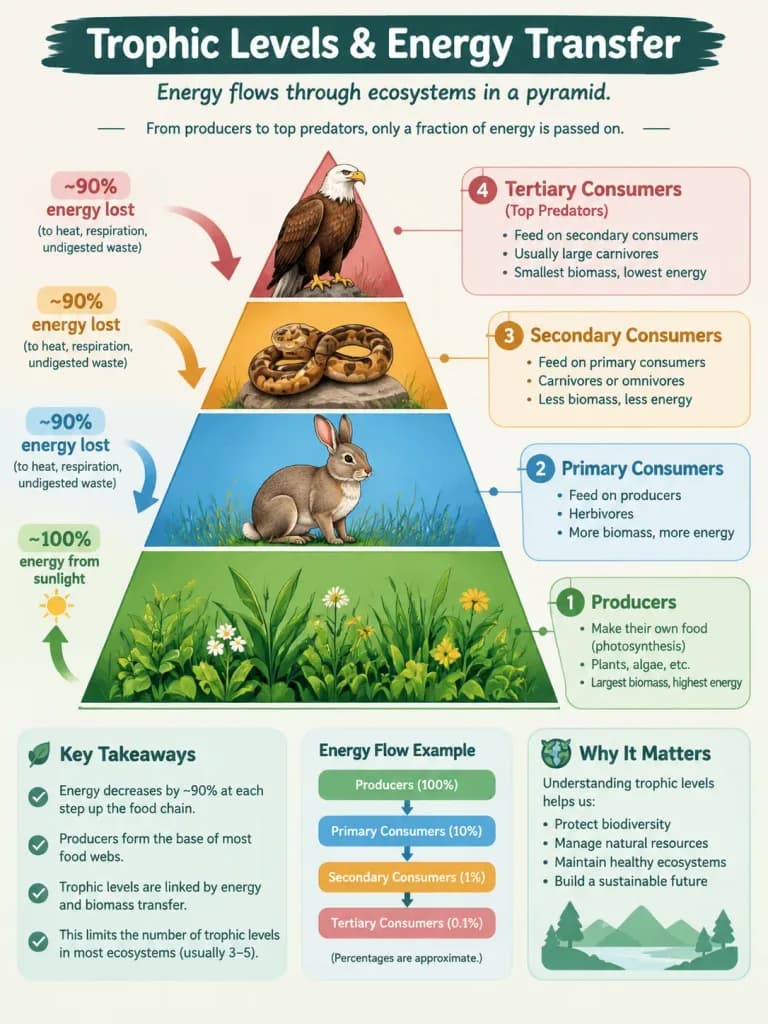
생태계 영양 단계 인포그래픽
영양 단계별 에너지 전달을 설명하는 깔끔한 교육용 생태 피라미드 인포그래픽을 생성합니다. 대상 독자를 수정하여 상세도와 스타일을 변경할 수 있습니다.
인포그래픽생태학영양단계생태피라미드과학일러스트교육생물학
유사한 프롬프트 둘러보기인포그래픽 AI 프롬프트
프롬프트
A detailed educational infographic designed for [college students] illustrating trophic levels and energy transfer in ecosystems. The composition centers on a tiered ecological pyramid showing energy and biomass flow, complete with labeled sections and concise definitions for producers, primary consumers, secondary consumers, and tertiary consumers. Clean modern vector graphic style, crisp typography, clear arrows showing percentage of energy loss between levels, balanced layout, scientific illustration aesthetics.
바꿔 쓸 수 있는 부분
생성하기 전에 프롬프트의 이 부분을 원하는 주제나 문구로 바꿔 보세요.
[college students]자리 표시자
프롬프트 정보
- 카테고리
- 인포그래픽 / 교육
- 모델
- GPT IMAGE 2.5 Sunburst
- 이미지당 비용
- 1K: 11 크레딧 · 2K: 22 크레딧 · 4K: 36 크레딧
- 화면 비율
- 3:4
- 추가일