
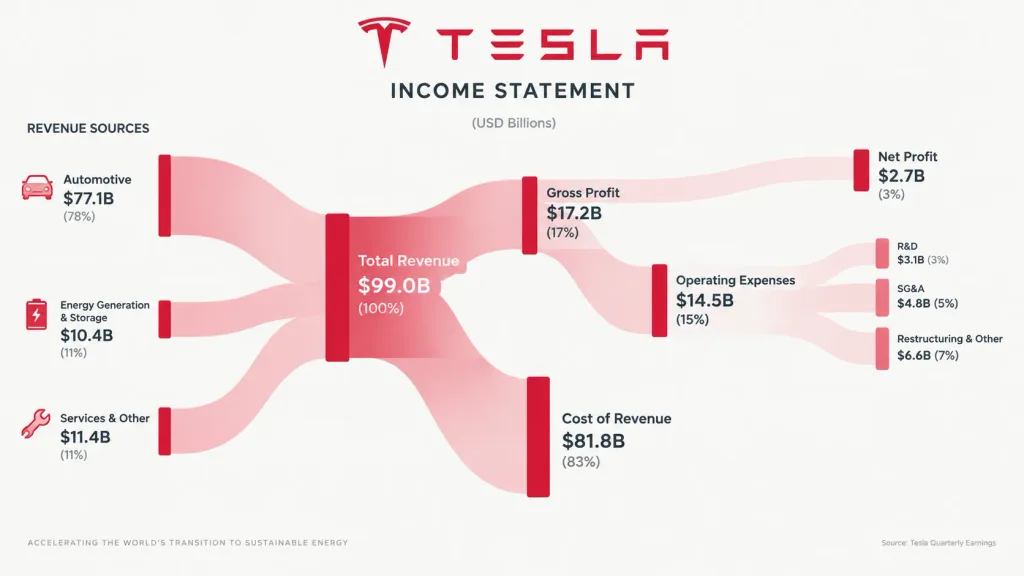
기업 재무 샌키 다이어그램
기업 손익계산서를 깔끔하게 시각화하는 재무 샌키 다이어그램을 생성합니다. 브랜드명과 주요 색상을 변경하여 다양하게 활용할 수 있습니다.
프롬프트
A professional financial Sankey diagram visualizing the Income Statement of [Tesla], in the style of App Economy Insights and corporate financial reports. Visual Style: High-fidelity vector infographic, clean minimalist aesthetic, flat design on a very light grey or off-white background. Color Scheme: Primary brand color [crimson red] as the dominant theme for main revenue flows and profit blocks, with saturated vertical node bars and semi-transparent, lighter-opacity gradient flowing ribbons for a cohesive palette. Composition: Horizontal flow from Left (Revenue Sources) to Right (Net Profit). Connecting paths feature silky smooth Bezier curves resembling liquid ribbons. Minimalist flat vector icons on the left represent business segments (automotive, energy, services). The official brand logo is centered at the top. Details: Crisp sans-serif typography, structured data visualization layout clearly separating Revenue, Gross Profit, Operating Expenses, and Net Profit.
바꿔 쓸 수 있는 부분
생성하기 전에 프롬프트의 이 부분을 원하는 주제나 문구로 바꿔 보세요.
[Tesla]자리 표시자[crimson red]자리 표시자
프롬프트 정보
- 카테고리
- 인포그래픽 / 교육
- 모델
- Nano Banana Pro
- 이미지당 비용
- 1K: 108 크레딧 · 2K: 108 크레딧 · 4K: 193 크레딧
- 화면 비율
- 16:9
- 라이선스
- MIT
- 추가일