
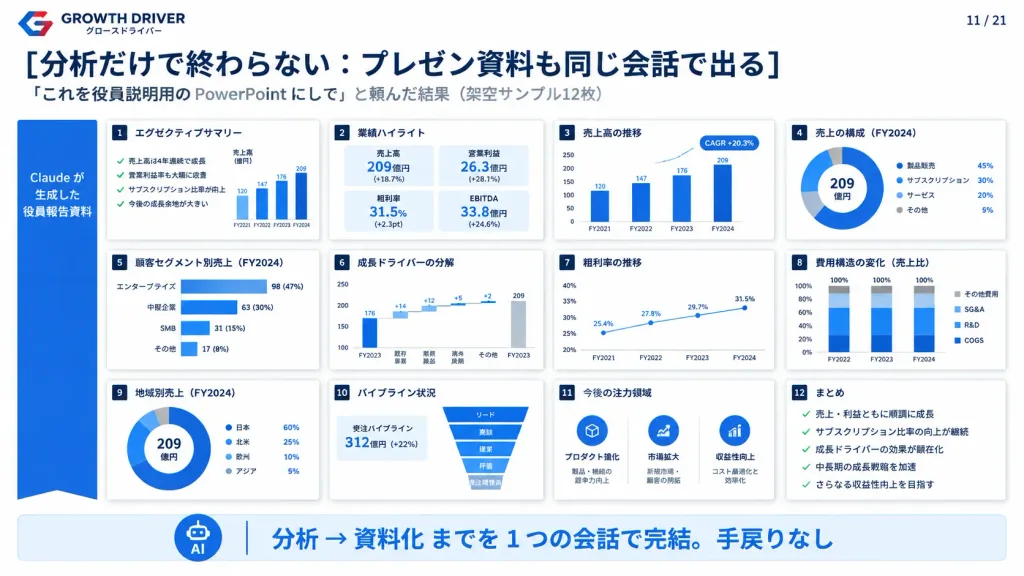
기업 임원 보고용 프레젠테이션 슬라이드 개요
12개의 미니어처 보고서 카드가 포함된 경영 컨설팅 스타일 슬라이드를 생성합니다. 대괄호 안의 브랜드명과 헤드라인, 차트 지표를 수정해 활용하세요.
프롬프트
Clean Japanese corporate presentation slide for [GROWTH DRIVER], demonstrating an AI tool converting complex analysis into executive board PowerPoint decks in a single conversation. Canvas: 16:9 widescreen presentation slide, solid white background, high-end management consulting slide aesthetic with navy blue (#0F2042) and bright blue accents, precise grid alignment, subtle drop shadows, crisp vector data visualizations, and realistic miniature slide thumbnails. Header: Top-left features an angular red and blue corporate logo mark alongside the brand text "GROWTH DRIVER" and Japanese subtext "グロースドライバー". Top-right displays page indicator "11 / 21". Prominent bold navy Japanese headline reads: "[分析だけで終わらない:プレゼン資料も同じ会話で出る]". Beneath it, a gray secondary subtitle reads: "[「これを役員説明用の PowerPoint にして」と頼んだ結果(架空サンプル12枚)]". Layout: Left side includes a vertical blue ribbon label reading "Claude が生成した 役員報告資料". The central area showcases exactly 12 miniature white slide cards organized in a balanced 4-column by 3-row grid. Each card has a small navy numbered badge (1 to 12) in its upper-left corner, a crisp Japanese section title, miniature charts, and subtle gray borders with soft shadows. The 12 cards feature: 1. "エグゼクティブサマリー" — Four checklist bullet points with green checkmarks alongside a micro bar chart (FY2021–FY2024: 120, 147, 176, 209). 2. "業績ハイライト" — Four KPI metric boxes: 売上高 209億円 (+18.7%), 営業利益 26.3億円 (+28.1%), 粗利率 31.5% (+2.3pt), EBITDA 33.8億円 (+24.6%). 3. "売上高の推移" — Vertical blue bar chart across FY2021–FY2024 with a callout bubble: "CAGR +20.3%". 4. "売上の構成(FY2024)" — Donut chart showing "209 億円" centered, with legend: 製品販売 45%, サブスクリプション 30%, サービス 20%, その他 5%. 5. "顧客セグメント別売上(FY2024)" — Horizontal bar chart: エンタープライズ 98 (47%), 中堅企業 63 (30%), SMB 31 (15%), その他 17 (8%). 6. "成長ドライバーの分解" — Waterfall bridge chart starting at FY2023 176 through increments +14, +12, +5, +2 to FY2024 209. 7. "粗利率の推移" — Upward trending blue line chart (FY2021: 25.4% to FY2024: 31.5%). 8. "費用構造の変化(売上比)" — Stacked column chart across FY2022–FY2024 breaking down COGS, R&D, SG&A, and other expenses. 9. "地域別売上(FY2024)" — Donut chart with center text "209 億円" and legend: 日本 60%, 北米 25%, 欧州 10%, アジア 5%. 10. "パイプライン状況" — Funnel pipeline graphic with headline metrics: 受注パイプライン 312億円 (+22%) and sales funnel stages from リード to 受注確度高. 11. "今後の注力領域" — Three circular blue icons with strategy labels: プロダクト強化, 市場拡大, 収益性向上. 12. "まとめ" — Summary card featuring five checkmarked bullet points. Bottom Banner: Full-width rounded light-blue callout bar across the bottom. At the far left, a clean circular AI assistant icon. Prominent bold blue Japanese text reads: "[分析 → 資料化 までを 1 つの会話で完結。手戻りなし]". Style: Professional business consulting deck, high information density, razor-sharp typography, minimalist graphic layout, no human figures, no photos, vector-clean execution.
바꿔 쓸 수 있는 부분
생성하기 전에 프롬프트의 이 부분을 원하는 주제나 문구로 바꿔 보세요.
[GROWTH DRIVER]자리 표시자[分析だけで終わらない:プレゼン資料も同じ会話で出る]자리 표시자[「これを役員説明用の PowerPoint にして」と頼んだ結果(架空サンプル12枚)]자리 표시자[分析 → 資料化 までを 1 つの会話で完結。手戻りなし]자리 표시자“GROWTH DRIVER”따옴표 안 문구“グロースドライバー”따옴표 안 문구“11 / 21”따옴표 안 문구“Claude が生成した 役員報告資料”따옴표 안 문구
프롬프트 정보
- 카테고리
- 인포그래픽 / 교육
- 모델
- GPT IMAGE 2
- 이미지당 비용
- 1K: 43 크레딧 · 2K: 86 크레딧 · 4K: 143 크레딧
- 화면 비율
- 16:9
- 추가일