
인포그래픽 / 교육
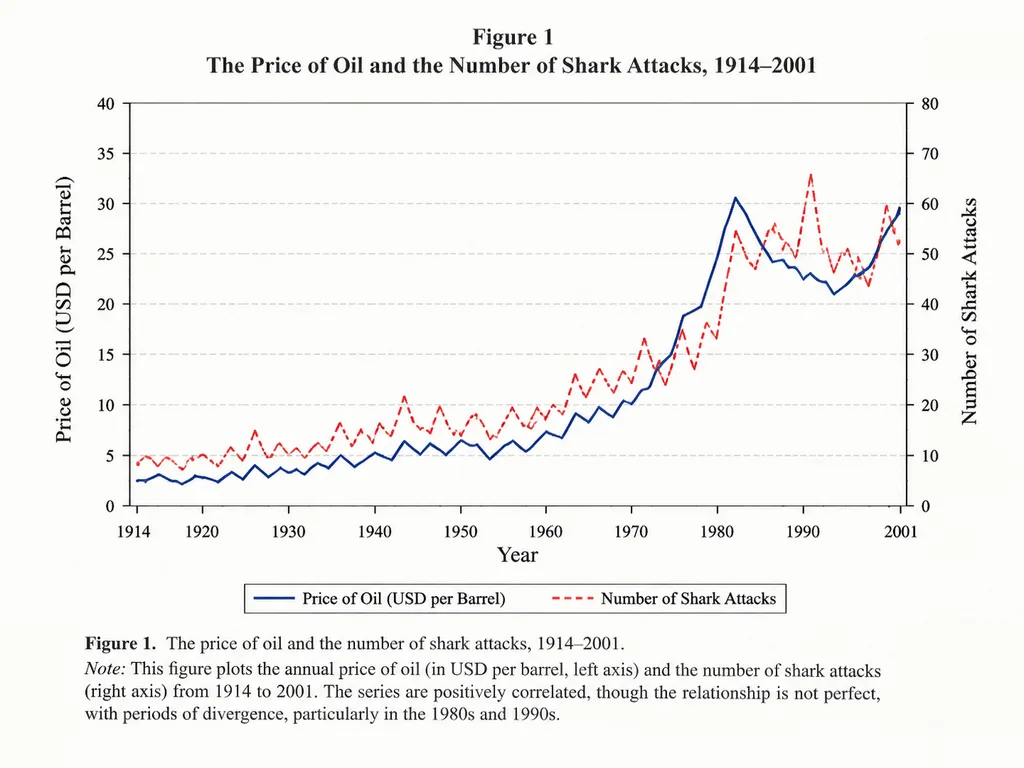
학술 상관관계 꺾은선형 차트
시간에 따른 두 변수를 비교하는 정통 학술 저널 스타일 차트를 생성합니다. 분야, 변수, 기간을 변경하여 맞춤형 그래프를 만들어 보세요.
꺾은선형 차트차트인포그래픽학술 논문경제학데이터 시각화
유사한 프롬프트 둘러보기인포그래픽 AI 프롬프트
프롬프트
An academic line graph figure from a prestigious [economics paper], demonstrating a close but imperfect correlation between [the price of oil] and [the number of shark attacks] across [the years 1914 to 2001]. The chart features clean dual y-axes, distinct trend lines, labeled axes, a neat legend, subtle grid lines, traditional serif academic typography, and a formal figure caption at the bottom, styled like a scan of a printed scholarly journal.
바꿔 쓸 수 있는 부분
생성하기 전에 프롬프트의 이 부분을 원하는 주제나 문구로 바꿔 보세요.
[economics paper]자리 표시자[the price of oil]자리 표시자[the number of shark attacks]자리 표시자[the years 1914 to 2001]자리 표시자
프롬프트 정보
- 카테고리
- 인포그래픽 / 교육
- 모델
- GPT IMAGE 2
- 이미지당 비용
- 1K: 43 크레딧 · 2K: 86 크레딧 · 4K: 143 크레딧
- 화면 비율
- 4:3
- 추가일