
Infografica / Educazione
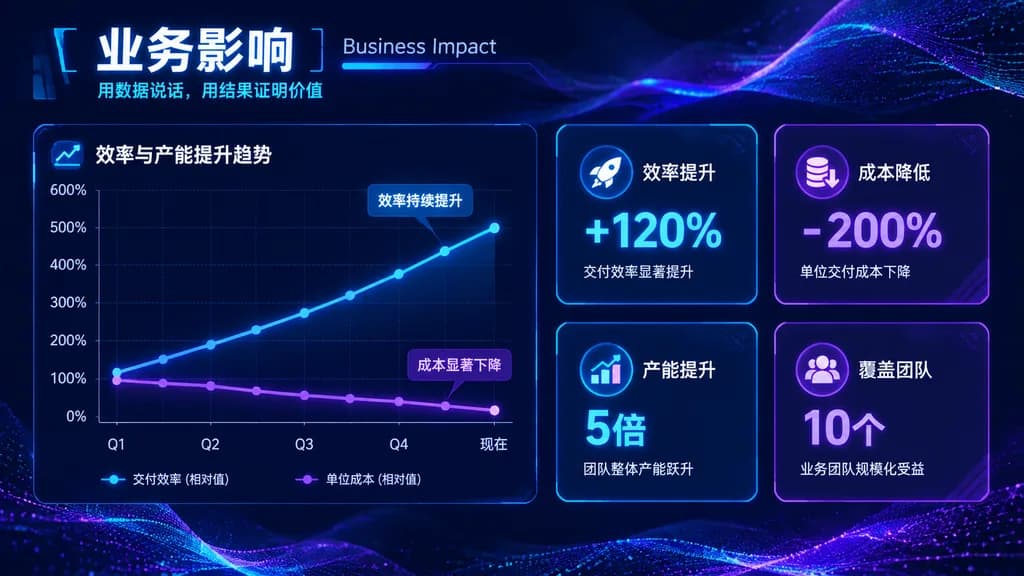
Diapositiva Aziendale Futuristica con KPI
Genera una slide aziendale scura con grafico a linee doppie e quattro schede KPI luminose. Modifica i parametri tra parentesi quadre per i tuoi dati.
slide di presentazionedashboard kpidark modedettagli neoninfograficareport aziendalegrafico a linee
Prompt
{
  "type": "corporate presentation slide",
  "theme": "high-tech, futuristic, dark mode, glowing neon blue and purple accents, abstract digital particle wave background",
  "header": {
    "title_primary": "[业务影响]",
    "title_secondary": "[Business Impact]",
    "tagline": "[用数据说话,用结果证明价值]"
  },
  "layout": {
    "left_section": {
      "type": "line chart",
      "title": "效率与产能提升趋势",
      "y_axis": [
        "0%",
        "100%",
        "200%",
        "300%",
        "400%",
        "500%",
        "600%"
      ],
      "x_axis": [
        "Q1",
        "Q2",
        "Q3",
        "Q4",
        "现在"
      ],
      "lines": [
        {
          "label": "交付效率 (相对值)",
          "color": "neon blue",
          "trend": "upward curve",
          "annotation": "效率持续提升"
        },
        {
          "label": "单位成本 (相对值)",
          "color": "neon purple",
          "trend": "downward curve",
          "annotation": "成本显著下降"
        }
      ]
    },
    "right_section": {
      "type": "kpi grid",
      "count": 4,
      "arrangement": "2x2 grid",
      "cards": [
        {
          "icon": "rocket",
          "title": "效率提升",
          "value": "[+120%]",
          "subtext": "交付效率显著提升"
        },
        {
          "icon": "coins with down arrow",
          "title": "成本降低",
          "value": "[-200%]",
          "subtext": "单位交付成本下降"
        },
        {
          "icon": "bar chart with up arrow",
          "title": "产能提升",
          "value": "[5倍]",
          "subtext": "团队整体产能跃升"
        },
        {
          "icon": "people group",
          "title": "覆盖团队",
          "value": "[10个]",
          "subtext": "业务团队规模化受益"
        }
      ]
    }
  }
}Cosa puoi personalizzare
Prima di generare, sostituisci queste parti del prompt con il tuo soggetto o testo.
[业务影响]segnaposto[Business Impact]segnaposto[用数据说话,用结果证明价值]segnaposto[+120%]segnaposto[-200%]segnaposto[5倍]segnaposto[10个]segnaposto
Dettagli del prompt
- Categoria
- Infografica / Educazione
- Modello
- GPT IMAGE 2
- Costo per immagine
- 1K: 43 crediti · 2K: 86 crediti · 4K: 143 crediti
- Proporzioni
- 16:9
- Aggiunto il