
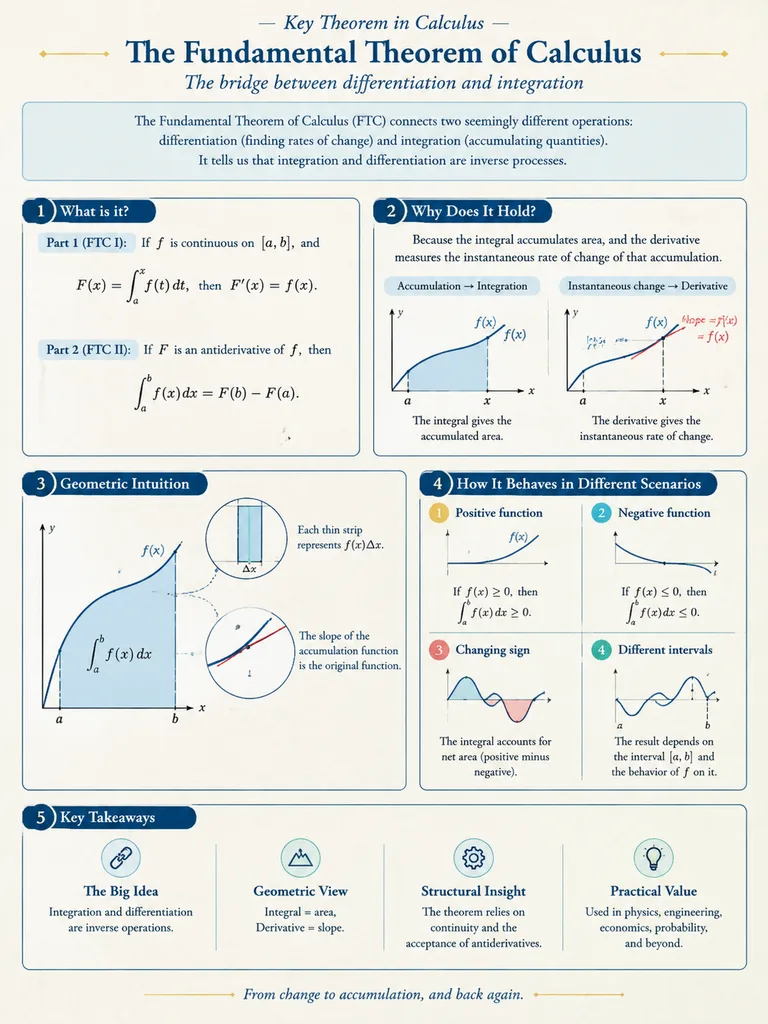
Poster Infografik Visualisasi Matematika
Hasilkan infografik bergaya poster akademik yang menjelaskan konsep matematika lewat diagram rapi. Sesuaikan topik dalam kurung siku dan tata letak sesuai kebutuhan.
Prompt
A mathematical visualization infographic explaining [mathematical concepts/knowledge points], designed to intuitively convey what it is, why it holds true, its geometric and structural intuition, and how it behaves across different scenarios. Styled as a high-quality academic lecture handout combined with a hand-drawn educational poster: elegant, clear, and informative without visual clutter. Layout: [vertical layout] on a clean light-colored paper texture background. Features dark blue headings, black and dark gray line art, accented with touches of cobalt blue, turquoise, gold, and muted red. Includes rounded-corner informational cards, thin borders, numbered labels, hand-drawn indicator arrows, circular magnification insets, and summary columns. Balanced, aesthetic, and rigorous academic illustration.
Yang bisa Anda ubah
Sebelum membuat gambar, ganti bagian prompt ini dengan subjek atau teks Anda sendiri.
[mathematical concepts/knowledge points]placeholder[vertical layout]placeholder
Detail prompt
- Kategori
- Infografik / Edukasi
- Model
- GPT IMAGE 2
- Biaya per gambar
- 1K: 43 kredit · 2K: 86 kredit · 4K: 143 kredit
- Rasio aspek
- 3:4
- Ditambahkan