
Infografik / Edukasi
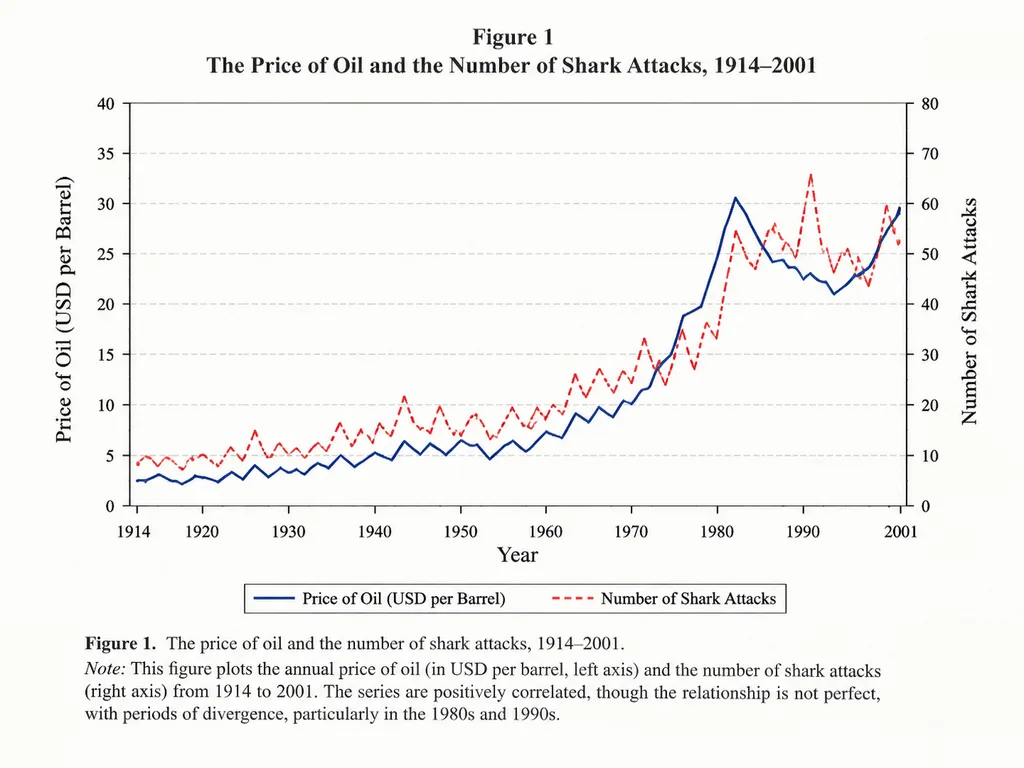
Grafik Garis Korelasi Akademis
Menghasilkan grafik jurnal ilmiah autentik yang membandingkan dua variabel dari waktu ke waktu. Ubah bidang, variabel, dan rentang waktu sesuai kebutuhan.
grafik garisgrafikinfografikjurnal ilmiahekonomivisualisasi data
Jelajahi prompt serupaPrompt AI Infografis
Prompt
An academic line graph figure from a prestigious [economics paper], demonstrating a close but imperfect correlation between [the price of oil] and [the number of shark attacks] across [the years 1914 to 2001]. The chart features clean dual y-axes, distinct trend lines, labeled axes, a neat legend, subtle grid lines, traditional serif academic typography, and a formal figure caption at the bottom, styled like a scan of a printed scholarly journal.
Yang bisa Anda ubah
Sebelum membuat gambar, ganti bagian prompt ini dengan subjek atau teks Anda sendiri.
[economics paper]placeholder[the price of oil]placeholder[the number of shark attacks]placeholder[the years 1914 to 2001]placeholder
Detail prompt
- Kategori
- Infografik / Edukasi
- Model
- GPT IMAGE 2
- Biaya per gambar
- 1K: 43 kredit · 2K: 86 kredit · 4K: 143 kredit
- Rasio aspek
- 4:3
- Ditambahkan