
Infografía / Educación
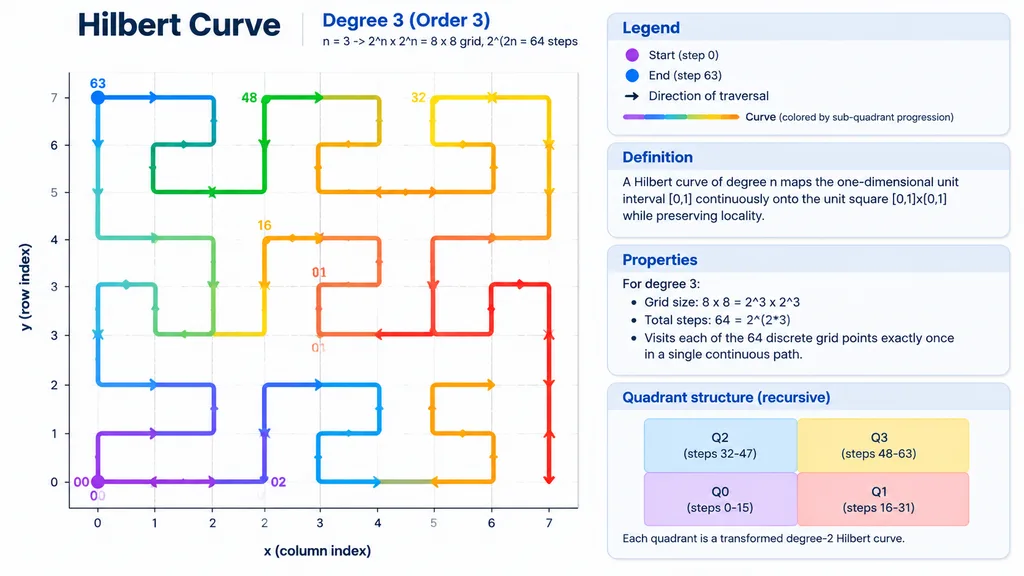
Infografía Educativa de la Curva de Hilbert
Genera una infografía matemática detallada de la curva de Hilbert de orden 3 con leyenda y fórmulas. Modifica los corchetes para cambiar el orden o colores.
curva de hilbertmatemáticasinfografíafractalvisualización de datoseducativo
Explorar prompts similaresPrompts de AI de Infografía
Prompt
{
  "type": "educational mathematical infographic",
  "header": {
    "title": "[Hilbert Curve]",
    "subtitle": "[Degree 3 (Order 3)]",
    "equation": "n = 3 -> 2^n x 2^n = 8 x 8 grid, 2^(2n) = 64 steps"
  },
  "layout": {
    "left_panel": "large 2D line plot",
    "right_sidebar": "stacked informational panels and text blocks"
  },
  "main_graph": {
    "axes": {
      "x_axis": "labeled 'x (column index)' with ticks 0 to 7",
      "y_axis": "labeled 'y (row index)' with ticks 0 to 7"
    },
    "grid": "[8x8] dashed light gray lines",
    "curve": {
      "description": "continuous non-intersecting space-filling path covering the entire grid",
      "style": "thick clean line with subtle directional traversal arrows",
      "colors": "[gradient transitioning through purple, blue, green, yellow, orange, and red]",
      "markers": [
        "purple dot at bottom left labeled '00'",
        "blue dot at top left labeled '63'"
      ],
      "labels": "two-digit step index labels along key path vertices, including 01, 02, 16, 32, 48, 63"
    }
  },
  "sidebar": {
    "sections": [
      {
        "title": "Legend",
        "type": "box with rounded corners",
        "items": [
          "purple dot: 'Start (step 0)'",
          "blue dot: 'End (step 63)'",
          "black arrow: 'Direction of traversal'",
          "colored lines: 'Curve (colored by sub-quadrant progression)'"
        ]
      },
      {
        "title": "Definition",
        "type": "text block",
        "text": "A Hilbert curve of degree n maps the one-dimensional unit interval [0,1] continuously onto the unit square [0,1]x[0,1] while preserving locality."
      },
      {
        "title": "Properties",
        "type": "bulleted list",
        "heading": "For degree 3:",
        "items": [
          "Grid size: 8 x 8 = 2^3 x 2^3",
          "Total steps: 64 = 2^(2*3)",
          "Visits each of the 64 discrete grid points exactly once in a single continuous path."
        ]
      },
      {
        "title": "Quadrant structure (recursive)",
        "type": "2x2 colored mini-grid diagram",
        "boxes": [
          "Top-left blue: 'Q2 (steps 32-47)'",
          "Top-right yellow: 'Q3 (steps 48-63)'",
          "Bottom-left purple: 'Q0 (steps 0-15)'",
          "Bottom-right pink: 'Q1 (steps 16-31)'"
        ],
        "footer_text": "Each quadrant is a transformed degree-2 Hilbert curve."
      }
    ]
  }
}Qué puedes personalizar
Antes de generar, cambia estas partes del prompt por tu propio tema o texto.
[Hilbert Curve]marcador[Degree 3 (Order 3)]marcador[8x8]marcador[0,1]marcador
Detalles del prompt
- Categoría
- Infografía / Educación
- Modelo
- GPT IMAGE 2
- Costo por imagen
- 1K: 43 créditos · 2K: 86 créditos · 4K: 143 créditos
- Relación de aspecto
- 16:9
- Añadido