
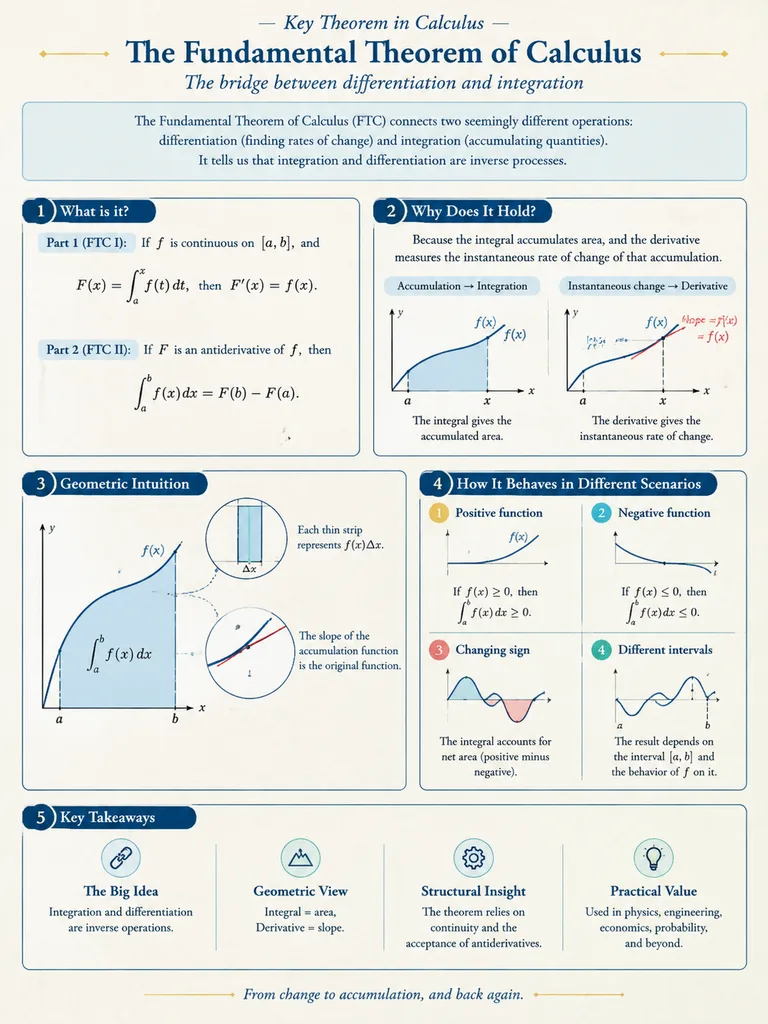
Инфографический плакат с визуализацией математики
Создает академический инфографический плакат, объясняющий сложные математические темы понятными схемами. Измените тему в скобках и ориентацию макета под свои задачи.
Промпт
A mathematical visualization infographic explaining [mathematical concepts/knowledge points], designed to intuitively convey what it is, why it holds true, its geometric and structural intuition, and how it behaves across different scenarios. Styled as a high-quality academic lecture handout combined with a hand-drawn educational poster: elegant, clear, and informative without visual clutter. Layout: [vertical layout] on a clean light-colored paper texture background. Features dark blue headings, black and dark gray line art, accented with touches of cobalt blue, turquoise, gold, and muted red. Includes rounded-corner informational cards, thin borders, numbered labels, hand-drawn indicator arrows, circular magnification insets, and summary columns. Balanced, aesthetic, and rigorous academic illustration.
Что можно изменить
Перед генерацией замените эти части промпта своей темой или текстом.
[mathematical concepts/knowledge points]заполнитель[vertical layout]заполнитель
Сведения о промпте
- Категория
- Инфографика / Образование
- Модель
- GPT IMAGE 2
- Стоимость за изображение
- 1K: 43 кредита · 2K: 86 кредитов · 4K: 143 кредита
- Соотношение сторон
- 3:4
- Добавлено