
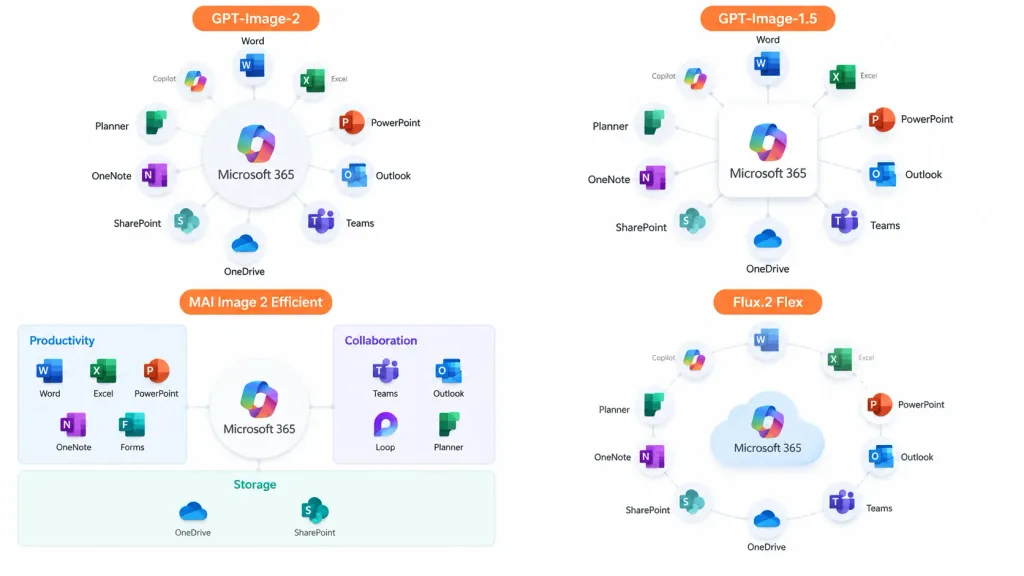
مخطط معلومات بياني لمقارنة الأنظمة التقنية
ينشئ شريحة عرض تقديمية من أربعة أرباع لمقارنة مخططات الأنظمة البرمجية بأساليب مختلفة. قم بتعديل أسماء المنتجات أو التطبيقات لتناسب مشروعك.
المطالبة
A clean 16:9 presentation comparison infographic showing the [Microsoft 365] ecosystem concept displayed across four quadrants in a 2×2 grid with generous whitespace and no hard divider lines, on a solid white background. Each quadrant displays an app ecosystem diagram centered on [Microsoft 365], surrounded by recognizable colored Microsoft app icons (Word, Excel, PowerPoint, Outlook, Teams, OneDrive, SharePoint, OneNote, Planner, Forms, Loop, Copilot) with crisp English labels and light gray connector lines. Each quadrant includes an orange label tag at the top: 1. Top-left: "[GPT-Image-2]" — polished circular hub diagram with app cards arranged radially around the central hub. 2. Top-right: "[GPT-Image-1.5]" — simplified radial hub diagram with icons orbiting a central square box. 3. Bottom-left: "[MAI Image 2 Efficient]" — structured dashboard-style diagram organized into labeled categories such as Productivity, Collaboration, and Storage. 4. Bottom-right: "[Flux.2 Flex]" — soft circular diagram with floating app icons orbiting a stylized cloud icon. Style: Modern corporate slide design, crisp vector icons, subtle drop shadows, clean typography, official Microsoft blue, green, orange, and purple color palette.
ما يمكنك تخصيصه
قبل الإنشاء، استبدل هذه الأجزاء من المطالبة بموضوعك أو نصك الخاص.
[Microsoft 365]عنصر نائب[GPT-Image-2]عنصر نائب[GPT-Image-1.5]عنصر نائب[MAI Image 2 Efficient]عنصر نائب[Flux.2 Flex]عنصر نائب
تفاصيل المطالبة
- النموذج
- GPT IMAGE 2
- التكلفة لكل صورة
- 1K: 43 رصيد · 2K: 86 رصيد · 4K: 143 رصيد
- نسبة العرض إلى الارتفاع
- 16:9
- تاريخ الإضافة