
الإنفوغرافيك والتعليم
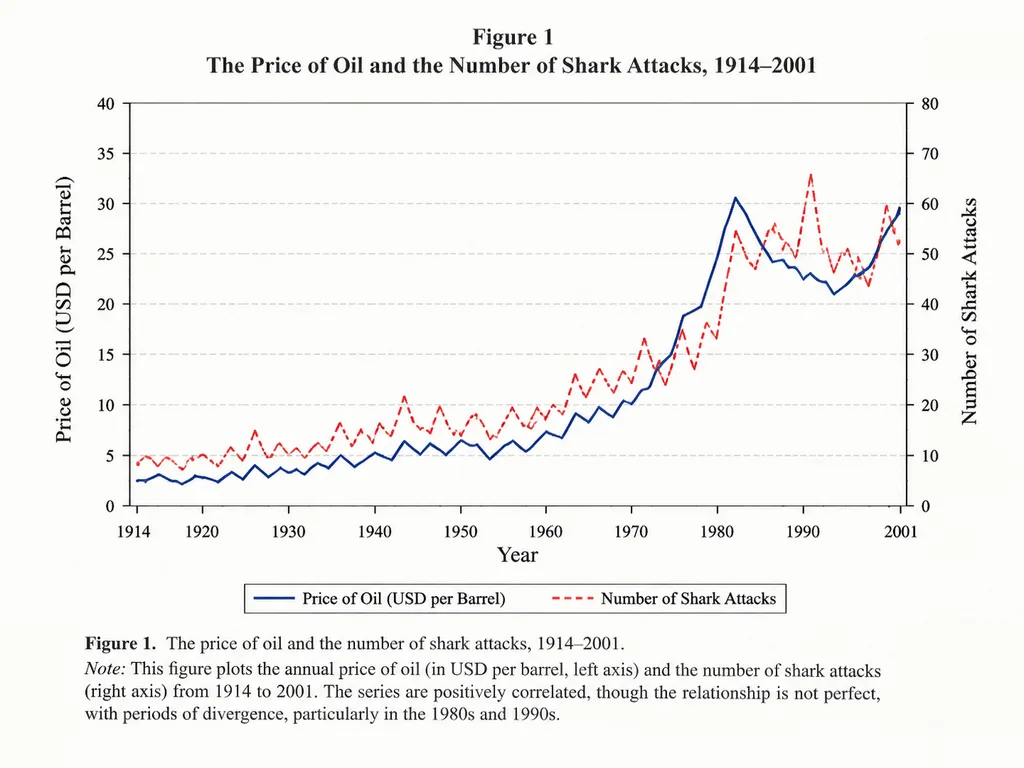
رسم بياني خطي للارتباط الأكاديمي
ينشئ رسمًا بيانيًا بنمط الدوريات الأكاديمية لمقارنة متغيرين عبر الزمن. عدّل التخصص والمتغيرات والفترة الزمنية لتخصيص الرسم.
رسم بياني خطيرسم بيانيإنفوجرافيكورقة أكاديميةاقتصادتصور البيانات
تصفح أوامر مشابهةأوامر AI لـ إنفوجرافيك
المطالبة
An academic line graph figure from a prestigious [economics paper], demonstrating a close but imperfect correlation between [the price of oil] and [the number of shark attacks] across [the years 1914 to 2001]. The chart features clean dual y-axes, distinct trend lines, labeled axes, a neat legend, subtle grid lines, traditional serif academic typography, and a formal figure caption at the bottom, styled like a scan of a printed scholarly journal.
ما يمكنك تخصيصه
قبل الإنشاء، استبدل هذه الأجزاء من المطالبة بموضوعك أو نصك الخاص.
[economics paper]عنصر نائب[the price of oil]عنصر نائب[the number of shark attacks]عنصر نائب[the years 1914 to 2001]عنصر نائب
تفاصيل المطالبة
- النموذج
- GPT IMAGE 2
- التكلفة لكل صورة
- 1K: 43 رصيد · 2K: 86 رصيد · 4K: 143 رصيد
- نسبة العرض إلى الارتفاع
- 4:3
- تاريخ الإضافة